> ## Documentation Index
> Fetch the complete documentation index at: https://getmonitor.io/docs/llms.txt
> Use this file to discover all available pages before exploring further.
# Status Pages Overview
> Create and manage public status pages to communicate service health to your users
## What Are Status Pages?
Status pages are public-facing websites that display the real-time operational status of your services. They help you transparently communicate with users about:
* Current system status
* Ongoing incidents
* Scheduled maintenance
* Historical uptime
* Service performance
## Status Pages List
Access your status pages from the **Status Pages** section in the sidebar.
 ### Status Page Card
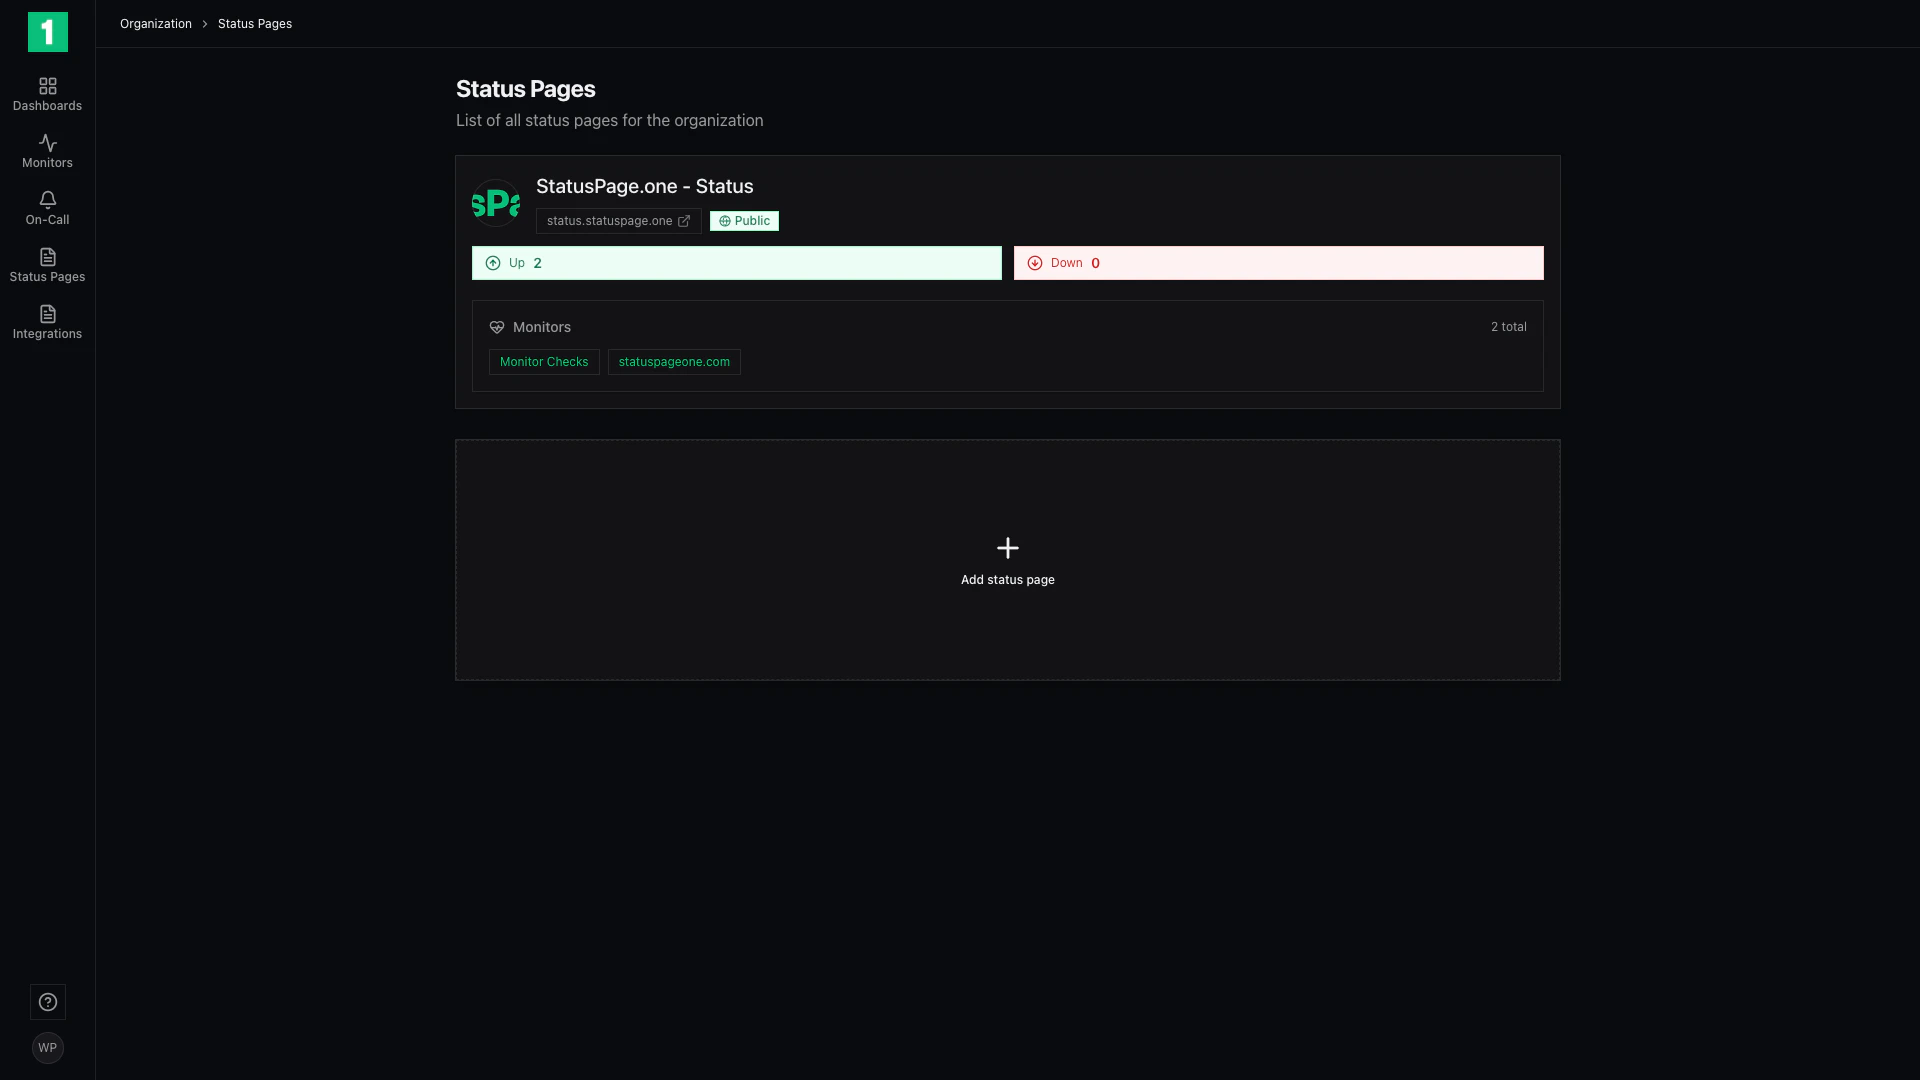
Each status page card displays:
* **Page Name** - Your status page title (e.g., "GetMonitor - Status")
* **Public URL** - The web address where users access your status page
* **Visibility Badge** - Shows if the page is Public or Private
* **Status Overview**
* **Up** - Number of operational monitors
* **Down** - Number of failing monitors
* **Monitor List** - Quick view of linked monitors (e.g., "Monitor Checks", "getmonitor.io")
* **Total Count** - How many monitors are displayed (e.g., "2 total")
### Status Page Navigation
When you select a status page, you can access:
* **Dashboard** - Analytics and performance metrics
* **Incidents** - Manage and track service incidents
* **Maintenance** - Schedule and communicate planned downtime
* **Subscriptions** - View users subscribed to updates
* **Components** - Organize monitors into logical groups
* **Customize** - Adjust branding and appearance
* **Settings** - Configure domain, badges, and other options
## Status Page Dashboard
The dashboard provides insights into your status page's performance and audience.
### Status Page Card
Each status page card displays:
* **Page Name** - Your status page title (e.g., "GetMonitor - Status")
* **Public URL** - The web address where users access your status page
* **Visibility Badge** - Shows if the page is Public or Private
* **Status Overview**
* **Up** - Number of operational monitors
* **Down** - Number of failing monitors
* **Monitor List** - Quick view of linked monitors (e.g., "Monitor Checks", "getmonitor.io")
* **Total Count** - How many monitors are displayed (e.g., "2 total")
### Status Page Navigation
When you select a status page, you can access:
* **Dashboard** - Analytics and performance metrics
* **Incidents** - Manage and track service incidents
* **Maintenance** - Schedule and communicate planned downtime
* **Subscriptions** - View users subscribed to updates
* **Components** - Organize monitors into logical groups
* **Customize** - Adjust branding and appearance
* **Settings** - Configure domain, badges, and other options
## Status Page Dashboard
The dashboard provides insights into your status page's performance and audience.
 ### Key Features
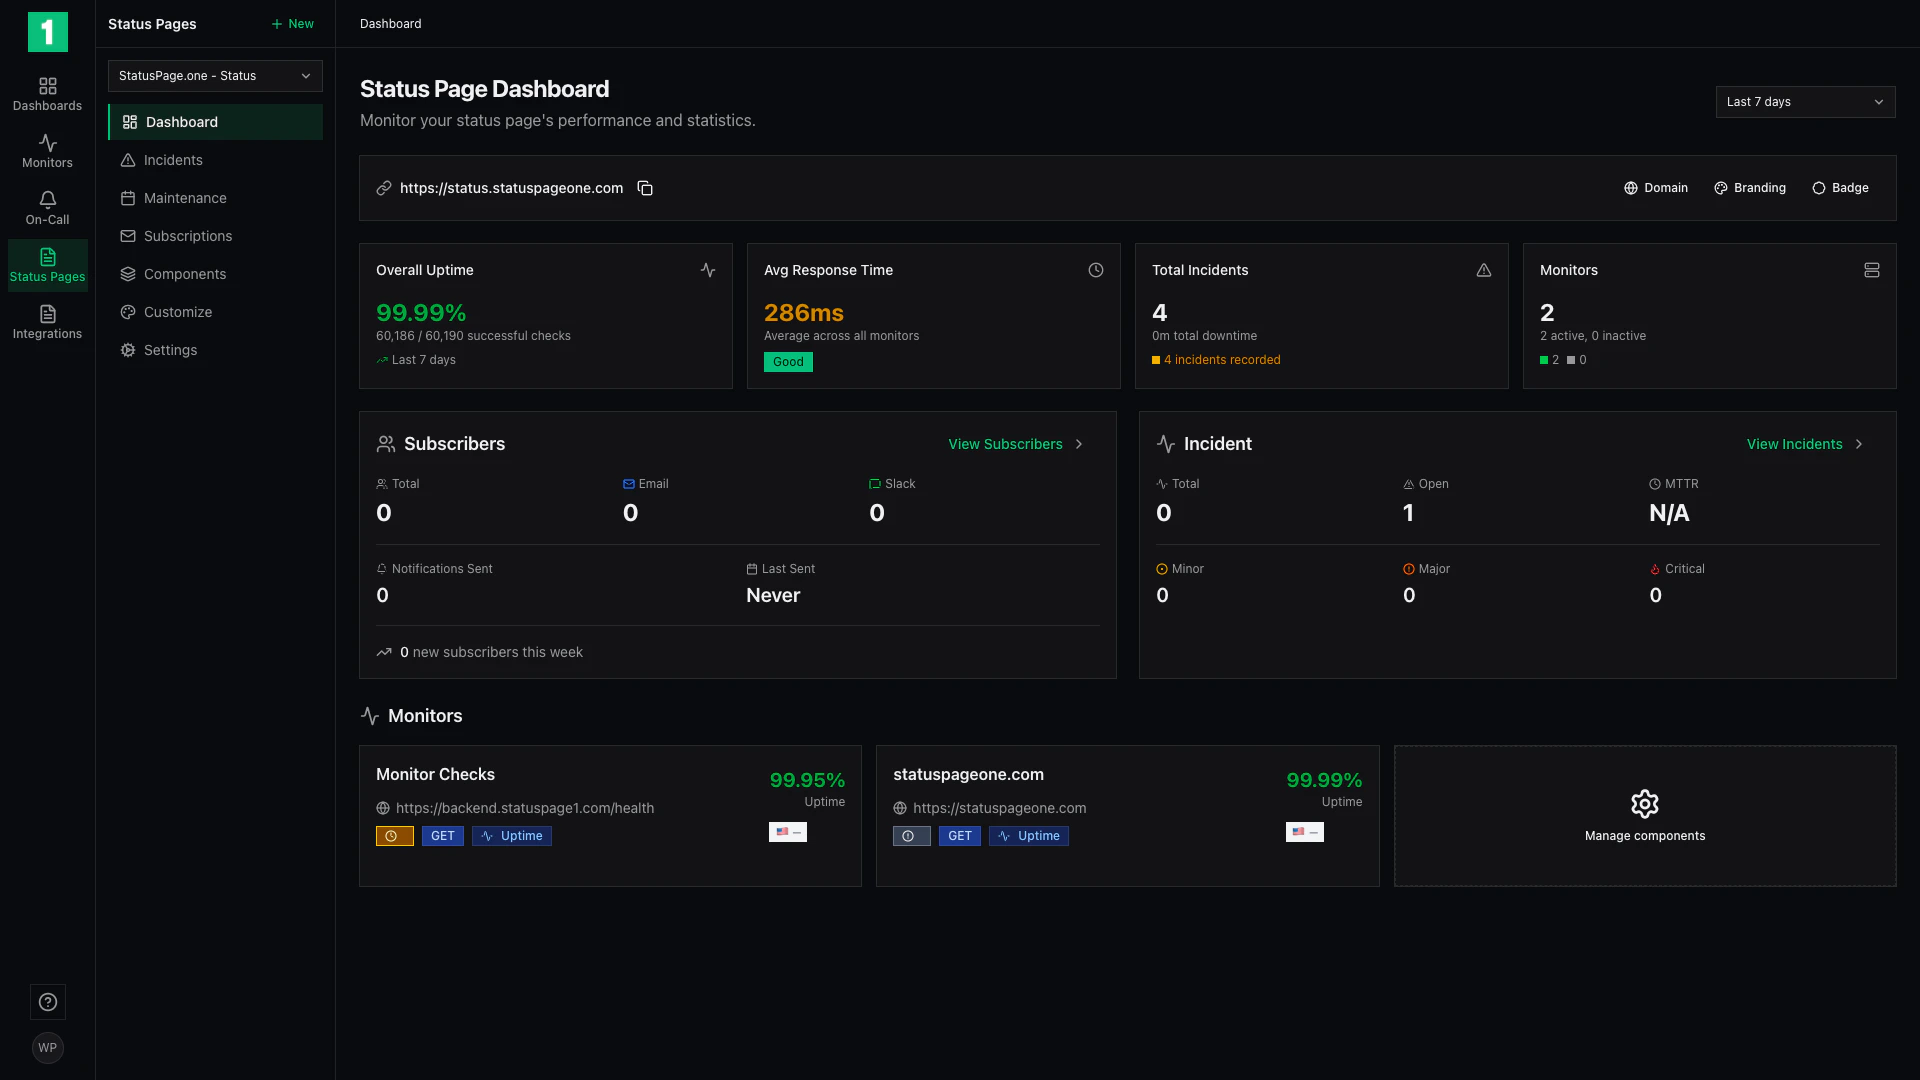
**Public URL Display:**
* Shows your status page URL
* Copy button for quick sharing
* Quick links to Domain, Branding, and Badge settings
**Performance Metrics:**
* **Overall Uptime** - Aggregate uptime across all monitors
* **Avg Response Time** - Average performance with quality badge (Excellent/Good/Poor)
* **Total Incidents** - Incident count and downtime minutes
* **Monitors** - Active/inactive monitor count with status indicators
**Subscribers Section:**
* **Total Subscribers** - Overall subscription count
* **Email Subscribers** - Users receiving email notifications
* **Slack Subscribers** - Teams receiving Slack notifications
* **Notifications Sent** - Total notifications delivered
* **Last Sent** - When the last notification went out
* **Growth Tracking** - New subscribers this week
**Incident Tracking:**
* **Total Incidents** - All incidents in the period
* **Open Incidents** - Currently active incidents
* **MTTR** - Mean Time To Resolution
* **Severity Breakdown** - Minor, Major, and Critical incident counts
### Time Range Selection
Use the time range dropdown (Last 7 days, 30 days, etc.) to view metrics for different periods.
## Public Status Page
This is what your users see when they visit your status page.
### Key Features
**Public URL Display:**
* Shows your status page URL
* Copy button for quick sharing
* Quick links to Domain, Branding, and Badge settings
**Performance Metrics:**
* **Overall Uptime** - Aggregate uptime across all monitors
* **Avg Response Time** - Average performance with quality badge (Excellent/Good/Poor)
* **Total Incidents** - Incident count and downtime minutes
* **Monitors** - Active/inactive monitor count with status indicators
**Subscribers Section:**
* **Total Subscribers** - Overall subscription count
* **Email Subscribers** - Users receiving email notifications
* **Slack Subscribers** - Teams receiving Slack notifications
* **Notifications Sent** - Total notifications delivered
* **Last Sent** - When the last notification went out
* **Growth Tracking** - New subscribers this week
**Incident Tracking:**
* **Total Incidents** - All incidents in the period
* **Open Incidents** - Currently active incidents
* **MTTR** - Mean Time To Resolution
* **Severity Breakdown** - Minor, Major, and Critical incident counts
### Time Range Selection
Use the time range dropdown (Last 7 days, 30 days, etc.) to view metrics for different periods.
## Public Status Page
This is what your users see when they visit your status page.
 ### Public Page Features
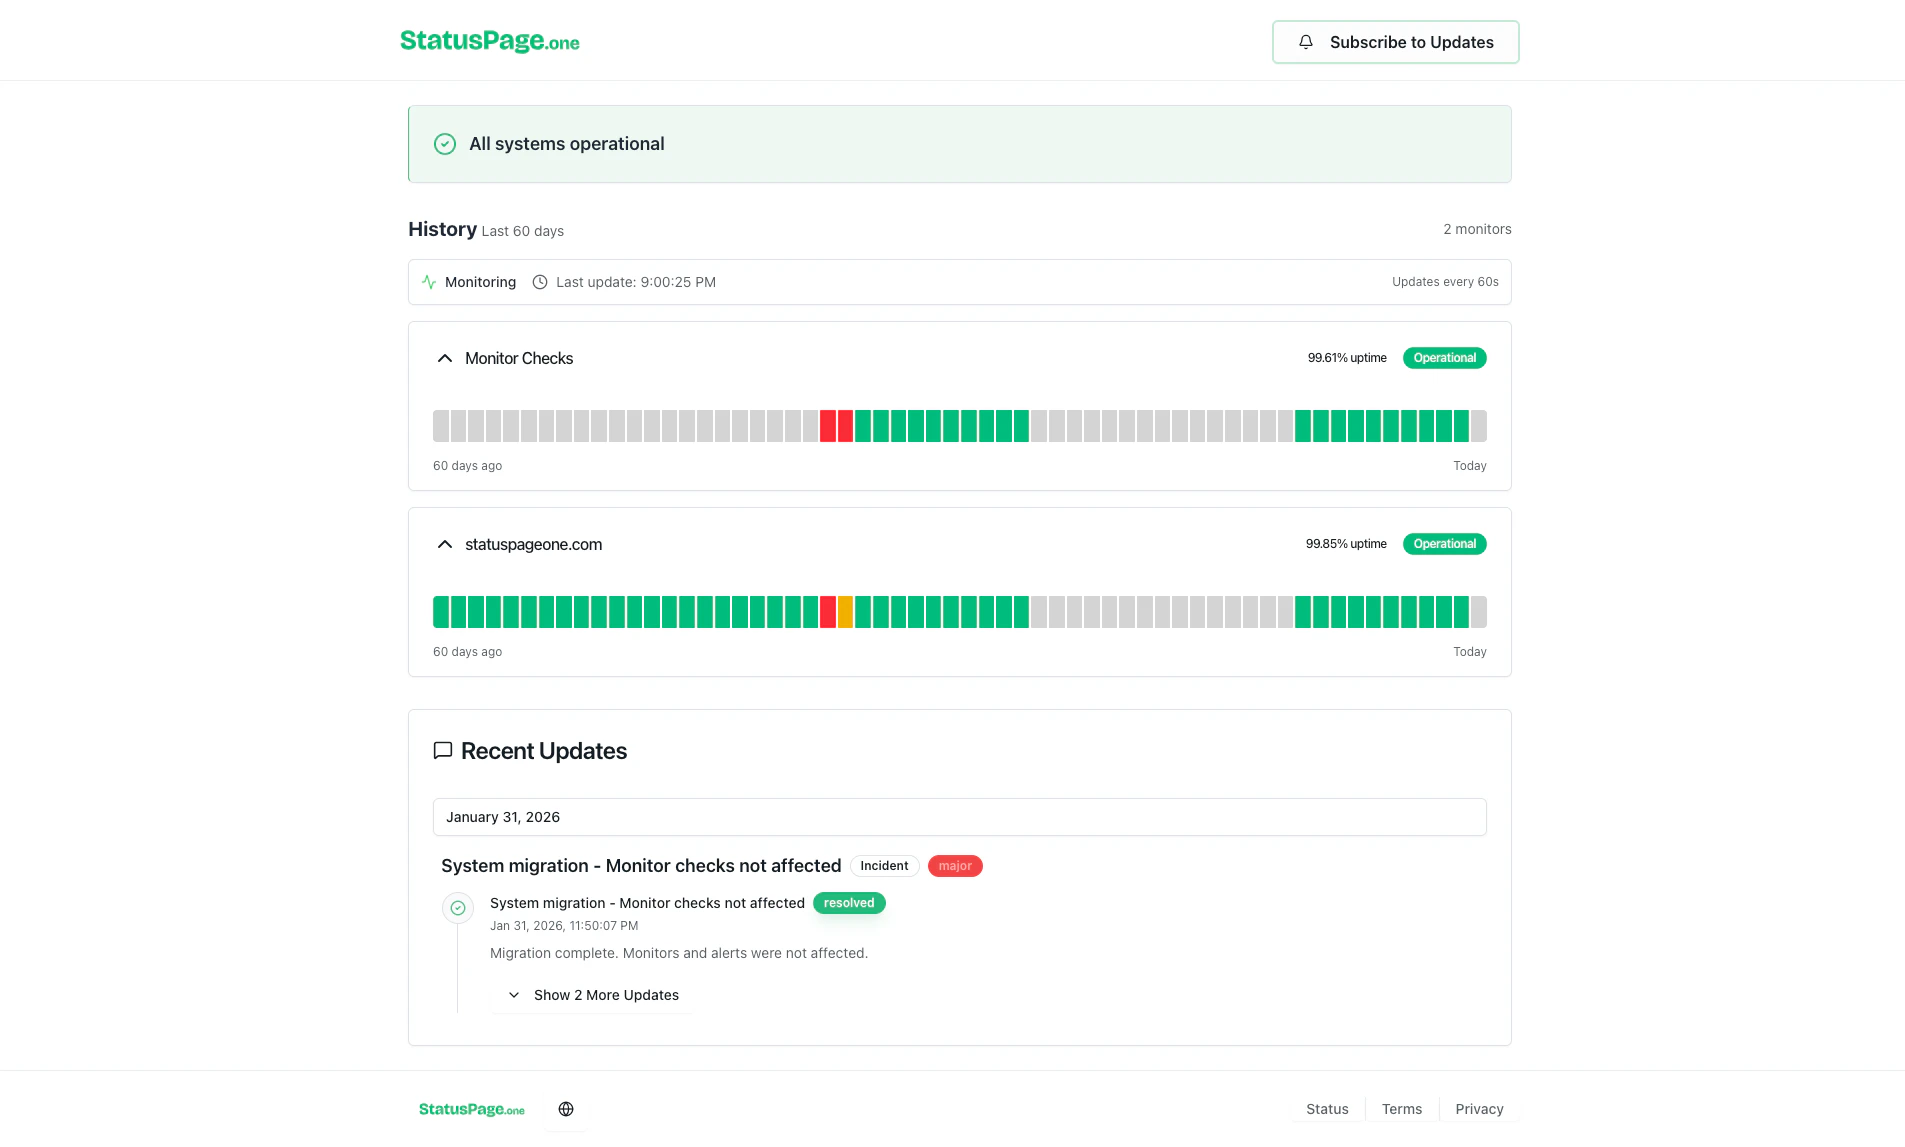
**Overall Status Banner:**
* Green banner: "All systems operational"
* Yellow banner: "Some systems experiencing issues"
* Red banner: "System outage in progress"
**Monitor Display:**
* Each monitor shows as a component with name and status
* **Uptime Percentage** - Displayed prominently (e.g., "99.61% uptime")
* **Status Badge** - Color-coded indicator (Operational/Degraded/Down)
* **Uptime History** - Visual bar chart showing last 60 days
* Green bars: Operational periods
* Orange/Yellow bars: Degraded performance
* Red bars: Downtime
* Gray bars: No data
**Update Information:**
* **Monitoring Status** - Shows if monitoring is active
* **Last Update** - Timestamp of most recent check
* **Update Frequency** - How often the page refreshes (e.g., "Updates every 60s")
**Recent Updates Section:**
* Displays incident updates and maintenance announcements
* Shows date, incident title, and status badge
* Expandable for more details ("Show 2 More Updates")
**Subscribe Button:**
* Users can click "Subscribe to Updates" to receive notifications
* Options for email or Slack subscriptions
**Footer:**
* Links to Status, Terms, and Privacy pages
* Company branding
## Creating Your First Status Page
From the Status Pages list, click the **+ Add status page** button.
Provide your status page name and select which monitors to display.
Adjust branding, colors, and layout to match your company style.
Copy your public status page URL and share it with users (in app, footer, etc.).
## Common Use Cases
Display API, web app, and database status for your customers
Show website, checkout, and payment processor availability
Communicate internal tool and service status to employees
Share API endpoint health and performance metrics
## Status Page vs Monitor
**Key Difference:**
* **Monitor** - Backend check that tests your service (internal view)
* **Status Page** - Public website that displays monitor status (user-facing view)
* **Component** - How a monitor is labeled on your status page
**Example:**
```
Monitor: "production-api-health-check"
↓
Component: "API Services"
↓
Status Page: Shows "API Services: Operational"
```
You can link multiple monitors to a single status page component. For example, group "Database Primary" and "Database Replica" monitors under one "Database" component.
## Best Practices
Don't overwhelm users with technical details. Group related services into broader components like "API" or "Website" rather than listing every microservice.
Post incident updates before users report problems. This reduces support load and builds trust.
During incidents, provide frequent updates (every 30-60 minutes) even if there's no new information. It shows you're actively working on the issue.
Add a "System Status" link in your application footer or header so users can easily find it.
Encourage users to subscribe so they receive automatic notifications during incidents.
Configure a custom domain (status.yourcompany.com) for a more professional appearance.
## Sharing Your Status Page
### Where to Link Your Status Page
* **Application Footer** - Standard placement most users expect
* **Help Center** - Include in your support documentation
* **Email Signatures** - Let support team share it easily
* **Social Media Profiles** - Add to Twitter, LinkedIn bio
* **API Documentation** - Essential for developer audiences
* **Mobile Apps** - Show during offline/error states
### Promotion Tips
```html theme={null}
System Status
```
## Status Page Analytics
The dashboard helps you understand:
* **User Engagement** - Subscriber growth and notification delivery
* **Service Reliability** - Uptime trends and incident frequency
* **Communication Effectiveness** - How many users receive updates
* **Performance Trends** - Response time patterns over time
Learn how to organize monitors into components and customize your status page
## Next Steps
Organize monitors into logical groups
Use your own domain (status.company.com)
Add status badges to your website
Create and update incidents
### Public Page Features
**Overall Status Banner:**
* Green banner: "All systems operational"
* Yellow banner: "Some systems experiencing issues"
* Red banner: "System outage in progress"
**Monitor Display:**
* Each monitor shows as a component with name and status
* **Uptime Percentage** - Displayed prominently (e.g., "99.61% uptime")
* **Status Badge** - Color-coded indicator (Operational/Degraded/Down)
* **Uptime History** - Visual bar chart showing last 60 days
* Green bars: Operational periods
* Orange/Yellow bars: Degraded performance
* Red bars: Downtime
* Gray bars: No data
**Update Information:**
* **Monitoring Status** - Shows if monitoring is active
* **Last Update** - Timestamp of most recent check
* **Update Frequency** - How often the page refreshes (e.g., "Updates every 60s")
**Recent Updates Section:**
* Displays incident updates and maintenance announcements
* Shows date, incident title, and status badge
* Expandable for more details ("Show 2 More Updates")
**Subscribe Button:**
* Users can click "Subscribe to Updates" to receive notifications
* Options for email or Slack subscriptions
**Footer:**
* Links to Status, Terms, and Privacy pages
* Company branding
## Creating Your First Status Page
From the Status Pages list, click the **+ Add status page** button.
Provide your status page name and select which monitors to display.
Adjust branding, colors, and layout to match your company style.
Copy your public status page URL and share it with users (in app, footer, etc.).
## Common Use Cases
Display API, web app, and database status for your customers
Show website, checkout, and payment processor availability
Communicate internal tool and service status to employees
Share API endpoint health and performance metrics
## Status Page vs Monitor
**Key Difference:**
* **Monitor** - Backend check that tests your service (internal view)
* **Status Page** - Public website that displays monitor status (user-facing view)
* **Component** - How a monitor is labeled on your status page
**Example:**
```
Monitor: "production-api-health-check"
↓
Component: "API Services"
↓
Status Page: Shows "API Services: Operational"
```
You can link multiple monitors to a single status page component. For example, group "Database Primary" and "Database Replica" monitors under one "Database" component.
## Best Practices
Don't overwhelm users with technical details. Group related services into broader components like "API" or "Website" rather than listing every microservice.
Post incident updates before users report problems. This reduces support load and builds trust.
During incidents, provide frequent updates (every 30-60 minutes) even if there's no new information. It shows you're actively working on the issue.
Add a "System Status" link in your application footer or header so users can easily find it.
Encourage users to subscribe so they receive automatic notifications during incidents.
Configure a custom domain (status.yourcompany.com) for a more professional appearance.
## Sharing Your Status Page
### Where to Link Your Status Page
* **Application Footer** - Standard placement most users expect
* **Help Center** - Include in your support documentation
* **Email Signatures** - Let support team share it easily
* **Social Media Profiles** - Add to Twitter, LinkedIn bio
* **API Documentation** - Essential for developer audiences
* **Mobile Apps** - Show during offline/error states
### Promotion Tips
```html theme={null}
System Status
```
## Status Page Analytics
The dashboard helps you understand:
* **User Engagement** - Subscriber growth and notification delivery
* **Service Reliability** - Uptime trends and incident frequency
* **Communication Effectiveness** - How many users receive updates
* **Performance Trends** - Response time patterns over time
Learn how to organize monitors into components and customize your status page
## Next Steps
Organize monitors into logical groups
Use your own domain (status.company.com)
Add status badges to your website
Create and update incidents