> ## Documentation Index
> Fetch the complete documentation index at: https://getmonitor.io/docs/llms.txt
> Use this file to discover all available pages before exploring further.
# Status Page Components
> Organize and display your monitors as components on your public status page
## What Are Components?
Components are how monitors appear on your public status page. They allow you to:
* Choose which monitors to display publicly
* Group related monitors together
* Present a simplified view to users
* Control what information is shared
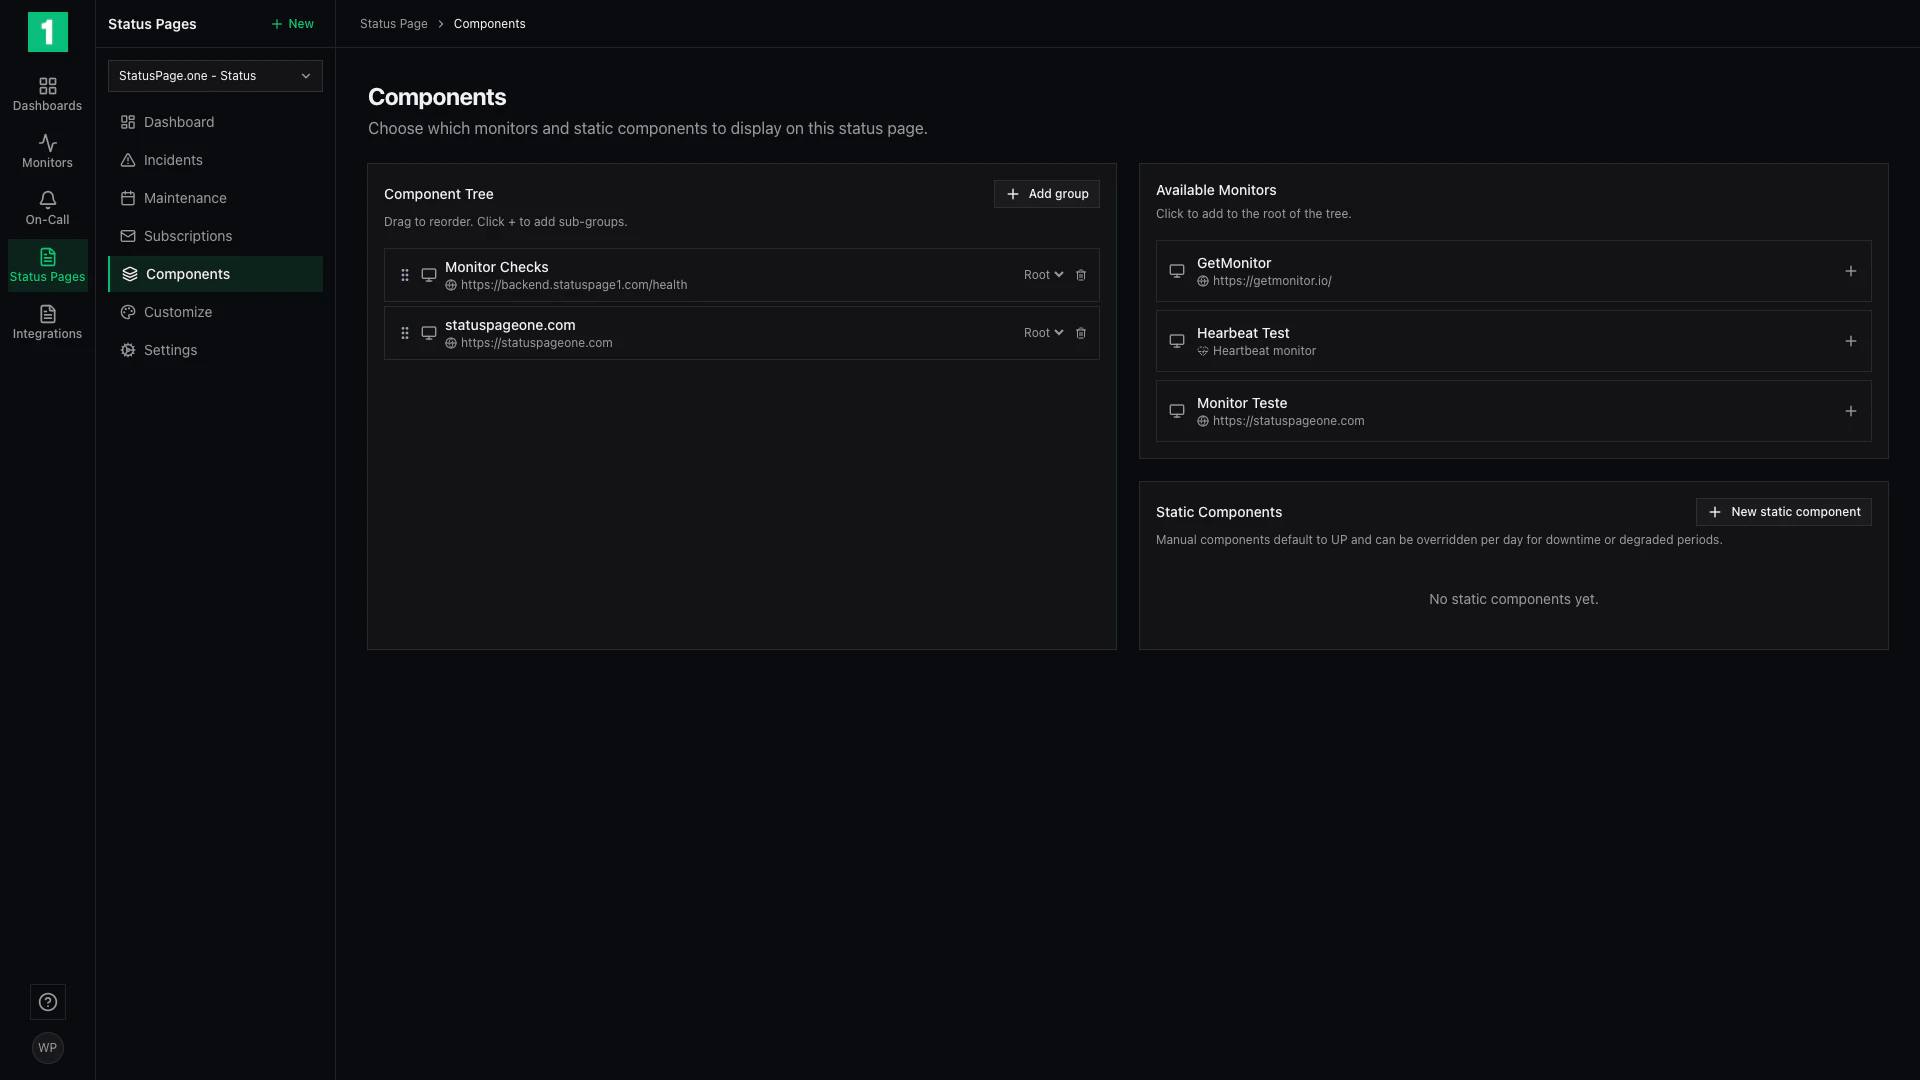 ## Accessing Components
To manage components for a status page:
1. Navigate to **Status Pages** in the sidebar
2. Select your status page
3. Click **Components**
## Monitor Selection
The Components page shows a list of all monitors in your organization that you can display on this status page.
### Selecting Monitors
Each monitor card displays:
* **Monitor Name** - The name of your monitor (e.g., "Monitor Checks", "getmonitor.io")
* **URL** - The endpoint being monitored
* **Checkbox** - Select to display on this status page
**To add a monitor to your status page:**
1. Check the box next to the monitor name
2. The selection count updates automatically (e.g., "2 monitor(s) selected for this status page")
**To remove a monitor:**
1. Uncheck the box next to the monitor name
2. It will no longer appear on your public status page
Monitors can be displayed on multiple status pages. This is useful if you have different status pages for different customer segments or regions.
## Component Display
When you select a monitor as a component:
* It appears on your public status page with its current status
* The monitor name becomes the component name
* Uptime percentage and history are displayed
* Status is updated in real-time
### How Components Appear to Users
On your public status page, each component shows:
* **Component Name** - The monitor's name
* **Current Status** - Operational, Degraded, or Down with color coding
* **Uptime Percentage** - Historical uptime (e.g., "99.61% uptime")
* **Uptime History Bar** - Visual representation of the last 60 days
Give your monitors user-friendly names since they'll be displayed publicly. "API Services" is better than "prod-api-health-check-us-east-1".
## Organizing Components
### Grouping Related Services
While each monitor creates one component, you can organize your status page by:
**Creating descriptive monitor names:**
* ✓ "Website"
* ✓ "API"
* ✓ "Database"
* ✓ "Payment Processing"
**Avoid technical names:**
* ✗ "nginx-prod-01"
* ✗ "postgres-primary-us-east"
* ✗ "k8s-ingress-controller"
### Multiple Monitors per Service
If you have multiple monitors for one service (e.g., primary and backup servers), you can:
1. **Create monitors with clear names:**
* "Database - Primary"
* "Database - Backup"
2. **Display both on your status page** so users see redundancy
3. **Or show only one** if you want a simplified view
If you uncheck all monitors, your status page will show no components. Users will see an empty history section.
## Best Practices
Display only user-facing services on your public status page. Internal tools don't need to be public.
Rename monitors to friendly names before adding them as components. Think about what users call your services.
Show 3-10 components maximum. Too many overwhelms users. Group related services if needed.
Organize components to match how users think about your service: "Website", "API", "Mobile App" rather than infrastructure details.
If you have multiple status pages, use similar component organization for consistency.
## Component Status Logic
### How Status is Determined
Each component's status is based on its linked monitor:
* **Operational (Green)** - Monitor is passing all checks
* **Degraded (Yellow)** - Monitor is experiencing partial failures
* **Down (Red)** - Monitor is failing checks
### Multiple Monitors (Future Feature)
In the future, components may support grouping multiple monitors:
* Overall status would show the worst state among all linked monitors
* If any monitor is down, the component shows as down
* If all are operational, the component shows as operational
## Managing Multiple Status Pages
### Using the Same Monitors on Different Pages
Monitors can appear on multiple status pages simultaneously:
**Use Case:** Different pages for different audiences
```
Status Page 1 (Public): Website, API, Mobile App
Status Page 2 (Enterprise): Website, API, Mobile App, Admin Portal, Reporting
Status Page 3 (Internal): All monitors including internal tools
```
**Use Case:** Regional status pages
```
Status Page (US): US-based monitors
Status Page (EU): EU-based monitors
Status Page (Global): All monitors
```
### Updating Component Selection
When you update which monitors are selected:
* Changes appear on the public page immediately
* Historical data remains intact
* Users see the updated component list on next page load
## Examples
### SaaS Application
```
Components:
☑ Website (www.example.com)
☑ API (api.example.com)
☑ Authentication Service
☑ File Storage
☐ Internal Admin Panel (not public)
☐ Development Environment (not public)
```
### E-commerce Platform
```
Components:
☑ Storefront
☑ Shopping Cart
☑ Checkout
☑ Payment Processing
☑ Order Management
☐ Warehouse System (not public)
```
### API Provider
```
Components:
☑ REST API v2
☑ GraphQL API
☑ Webhooks
☑ Documentation Site
☐ Internal Staging API (not public)
```
## Troubleshooting
**Cause:** You may not have created any monitors yet, or monitors may belong to a different organization.
**Solution:** Create monitors first, then add them to your status page.
**Cause:** The linked monitor may be incorrectly configured.
**Solution:** Check the monitor's settings and verify the URL and expected response code are correct.
**Cause:** Browser caching may be showing old data.
**Solution:** Refresh your browser (Cmd/Ctrl + Shift + R) to see the latest version.
## Next Steps
Set up a custom domain for your status page
Add status badges to your website
Create incident updates for your components
Add more monitors to display
## Accessing Components
To manage components for a status page:
1. Navigate to **Status Pages** in the sidebar
2. Select your status page
3. Click **Components**
## Monitor Selection
The Components page shows a list of all monitors in your organization that you can display on this status page.
### Selecting Monitors
Each monitor card displays:
* **Monitor Name** - The name of your monitor (e.g., "Monitor Checks", "getmonitor.io")
* **URL** - The endpoint being monitored
* **Checkbox** - Select to display on this status page
**To add a monitor to your status page:**
1. Check the box next to the monitor name
2. The selection count updates automatically (e.g., "2 monitor(s) selected for this status page")
**To remove a monitor:**
1. Uncheck the box next to the monitor name
2. It will no longer appear on your public status page
Monitors can be displayed on multiple status pages. This is useful if you have different status pages for different customer segments or regions.
## Component Display
When you select a monitor as a component:
* It appears on your public status page with its current status
* The monitor name becomes the component name
* Uptime percentage and history are displayed
* Status is updated in real-time
### How Components Appear to Users
On your public status page, each component shows:
* **Component Name** - The monitor's name
* **Current Status** - Operational, Degraded, or Down with color coding
* **Uptime Percentage** - Historical uptime (e.g., "99.61% uptime")
* **Uptime History Bar** - Visual representation of the last 60 days
Give your monitors user-friendly names since they'll be displayed publicly. "API Services" is better than "prod-api-health-check-us-east-1".
## Organizing Components
### Grouping Related Services
While each monitor creates one component, you can organize your status page by:
**Creating descriptive monitor names:**
* ✓ "Website"
* ✓ "API"
* ✓ "Database"
* ✓ "Payment Processing"
**Avoid technical names:**
* ✗ "nginx-prod-01"
* ✗ "postgres-primary-us-east"
* ✗ "k8s-ingress-controller"
### Multiple Monitors per Service
If you have multiple monitors for one service (e.g., primary and backup servers), you can:
1. **Create monitors with clear names:**
* "Database - Primary"
* "Database - Backup"
2. **Display both on your status page** so users see redundancy
3. **Or show only one** if you want a simplified view
If you uncheck all monitors, your status page will show no components. Users will see an empty history section.
## Best Practices
Display only user-facing services on your public status page. Internal tools don't need to be public.
Rename monitors to friendly names before adding them as components. Think about what users call your services.
Show 3-10 components maximum. Too many overwhelms users. Group related services if needed.
Organize components to match how users think about your service: "Website", "API", "Mobile App" rather than infrastructure details.
If you have multiple status pages, use similar component organization for consistency.
## Component Status Logic
### How Status is Determined
Each component's status is based on its linked monitor:
* **Operational (Green)** - Monitor is passing all checks
* **Degraded (Yellow)** - Monitor is experiencing partial failures
* **Down (Red)** - Monitor is failing checks
### Multiple Monitors (Future Feature)
In the future, components may support grouping multiple monitors:
* Overall status would show the worst state among all linked monitors
* If any monitor is down, the component shows as down
* If all are operational, the component shows as operational
## Managing Multiple Status Pages
### Using the Same Monitors on Different Pages
Monitors can appear on multiple status pages simultaneously:
**Use Case:** Different pages for different audiences
```
Status Page 1 (Public): Website, API, Mobile App
Status Page 2 (Enterprise): Website, API, Mobile App, Admin Portal, Reporting
Status Page 3 (Internal): All monitors including internal tools
```
**Use Case:** Regional status pages
```
Status Page (US): US-based monitors
Status Page (EU): EU-based monitors
Status Page (Global): All monitors
```
### Updating Component Selection
When you update which monitors are selected:
* Changes appear on the public page immediately
* Historical data remains intact
* Users see the updated component list on next page load
## Examples
### SaaS Application
```
Components:
☑ Website (www.example.com)
☑ API (api.example.com)
☑ Authentication Service
☑ File Storage
☐ Internal Admin Panel (not public)
☐ Development Environment (not public)
```
### E-commerce Platform
```
Components:
☑ Storefront
☑ Shopping Cart
☑ Checkout
☑ Payment Processing
☑ Order Management
☐ Warehouse System (not public)
```
### API Provider
```
Components:
☑ REST API v2
☑ GraphQL API
☑ Webhooks
☑ Documentation Site
☐ Internal Staging API (not public)
```
## Troubleshooting
**Cause:** You may not have created any monitors yet, or monitors may belong to a different organization.
**Solution:** Create monitors first, then add them to your status page.
**Cause:** The linked monitor may be incorrectly configured.
**Solution:** Check the monitor's settings and verify the URL and expected response code are correct.
**Cause:** Browser caching may be showing old data.
**Solution:** Refresh your browser (Cmd/Ctrl + Shift + R) to see the latest version.
## Next Steps
Set up a custom domain for your status page
Add status badges to your website
Create incident updates for your components
Add more monitors to display