> ## Documentation Index
> Fetch the complete documentation index at: https://getmonitor.io/docs/llms.txt
> Use this file to discover all available pages before exploring further.
# Monitor Statistics
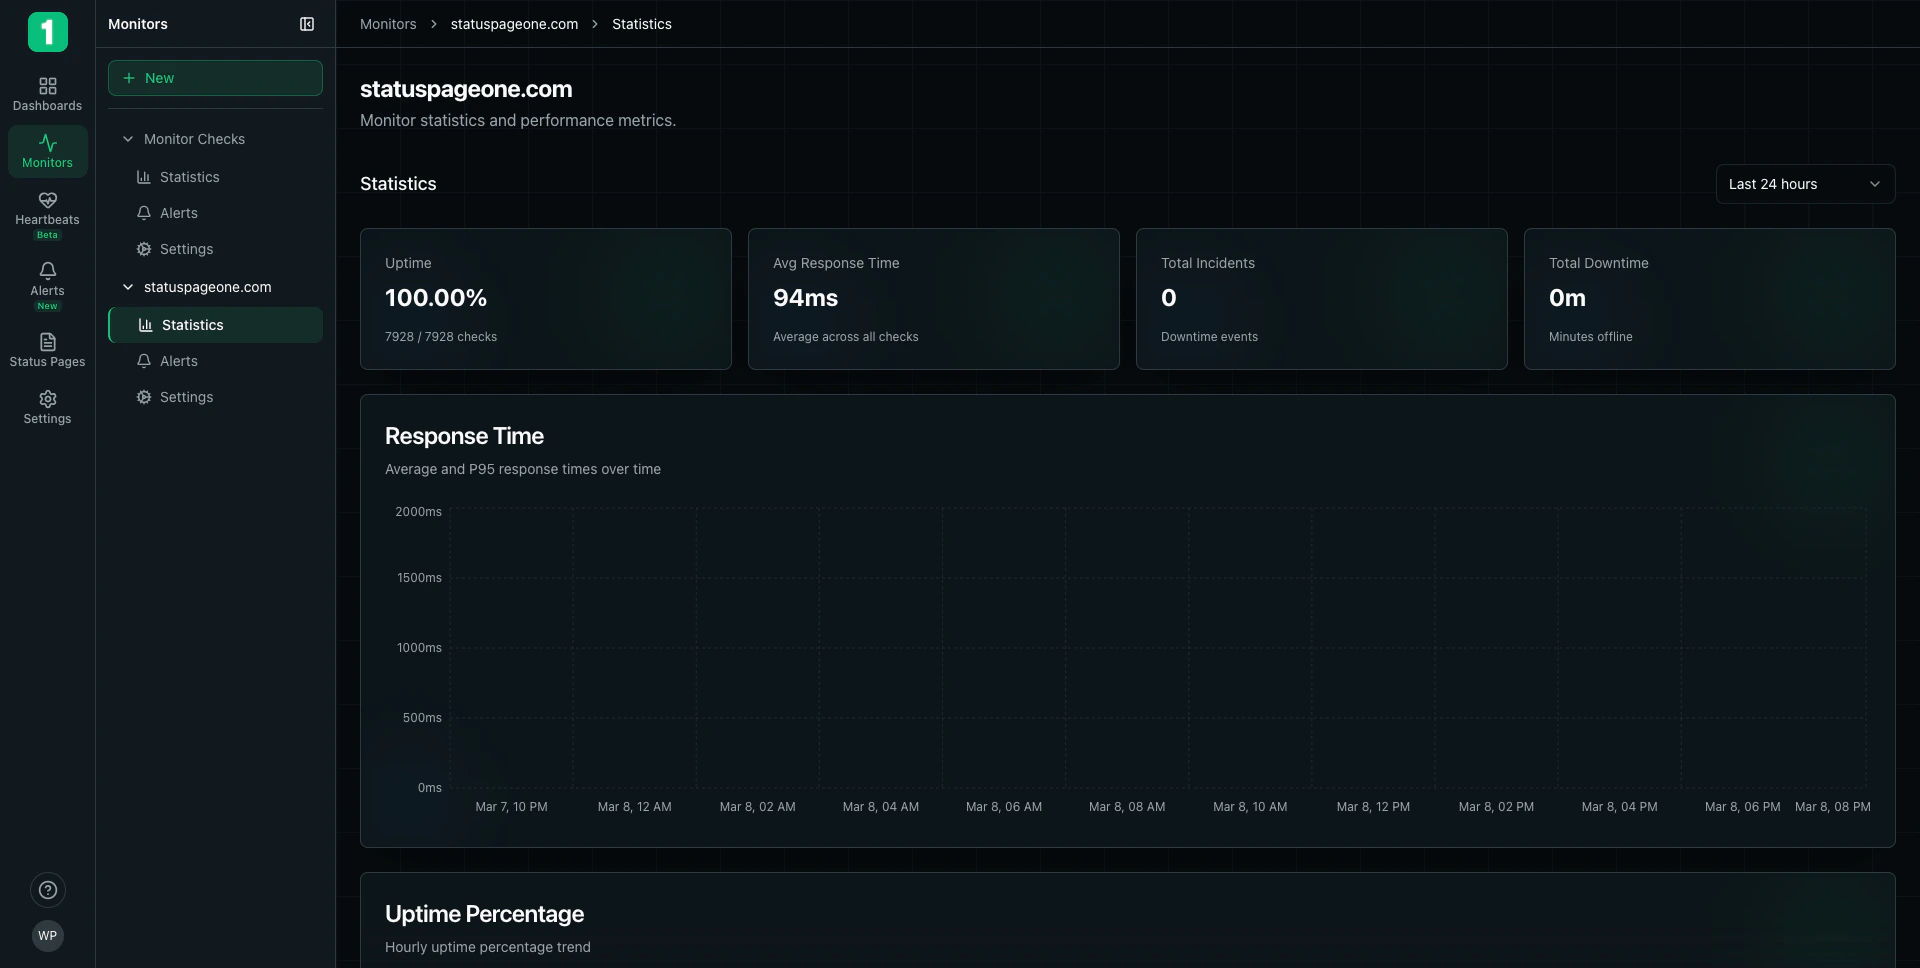
> View and analyze your monitor's performance metrics, uptime trends, and response times
## Accessing Statistics
To view detailed statistics for a monitor:
1. Navigate to **Monitors** in the sidebar
2. Click on the monitor name to expand it
3. Select **Statistics**
 ## Time Range Selection
Use the time range selector in the top right to view statistics for different periods:
* **Last 24 hours** - Most recent day of data
* **Last 7 days** - Weekly trends
* **Last 30 days** - Monthly overview
* **Last 90 days** - Quarterly analysis
* **Custom range** - Specific date range
Start with "Last 24 hours" for recent issues, then zoom out to longer periods to identify trends.
## Key Metrics
The statistics page displays four primary metrics at the top:
### Uptime Percentage
Shows the percentage of successful checks during the selected time period.
**Example:** `100.00%`
* **100%** - Perfect uptime, all checks successful
* **99.9%** - Highly reliable (approximately 43 minutes downtime per month)
* **99.0%** - Acceptable (approximately 7 hours downtime per month)
* **Below 99%** - Indicates reliability issues requiring attention
**Check Count:**
Shows successful checks vs. total checks (e.g., "7928 / 7928 checks")
### Average Response Time
The mean response time across all checks in the selected period.
**Example:** `94ms`
**Interpreting Response Times:**
* **0-100ms** - Excellent performance
* **100-300ms** - Good performance
* **300-1000ms** - Acceptable, monitor for degradation
* **1000ms+** - Slow, may impact user experience
Response time includes DNS lookup, connection establishment, and data transfer - the complete user experience.
### Total Incidents
Number of downtime events during the selected period.
**Example:** `0`
An incident is counted when:
* Multiple consecutive checks fail (based on alert sensitivity)
* Monitor transitions from operational to down/degraded
**Downtime Events:**
Lower is better. Zero incidents indicates perfect reliability.
### Total Downtime
Total minutes the monitor was offline during the selected period.
**Example:** `0m`
**Understanding Downtime:**
* **0 minutes** - No downtime detected
* **\< 5 minutes** - Brief outage, possibly maintenance
* **5-60 minutes** - Significant incident
* **> 60 minutes** - Major outage requiring investigation
## Response Time Chart
### Average and P95 Response Times
The response time chart shows two important metrics:
**Average Response Time (Blue/Green Line):**
* Mean response time across all checks
* Shows typical performance
* Useful for identifying gradual degradation
**P95 Response Time (Orange/Yellow Line):**
* 95th percentile response time
* 95% of requests are faster than this value
* Reveals worst-case performance users experience
### Reading the Chart
**Y-Axis:** Response time in milliseconds (ms)
**X-Axis:** Time period
**Patterns to Watch:**
* **Flat lines** - Consistent, predictable performance
* **Gradual increase** - Performance degrading over time
* **Spikes** - Temporary performance issues
* **High P95 divergence** - Some users experiencing slow responses
If P95 is significantly higher than average, some users are experiencing much slower responses than others.
## Uptime Percentage Chart
### Hourly Uptime Trend
Shows uptime percentage calculated hourly over the selected time period.
**Y-Axis:** Uptime percentage (0-100%)
**X-Axis:** Time (hours)
**What to Look For:**
* **Flat at 100%** - Perfect uptime
* **Dips below 100%** - Periods of downtime or failed checks
* **Patterns** - Recurring issues at specific times (e.g., daily at midnight might indicate scheduled processes)
### Understanding Hourly Calculations
Each point on the chart represents the uptime percentage for that specific hour:
* If all checks in an hour succeeded: 100%
* If some checks failed: Lower percentage based on failure rate
* If all checks failed: 0%
## Using Statistics for Analysis
### Performance Optimization
Review 30-day statistics to understand typical response times and uptime patterns.
Define acceptable performance targets (e.g., 99.9% uptime, \< 200ms average response).
Regularly check statistics to catch performance degradation early.
When you see unusual patterns, correlate with deployments, traffic changes, or infrastructure changes.
### Incident Investigation
When investigating an incident:
1. **Check Total Incidents** - Identify how many outages occurred
2. **Review Uptime Chart** - Pinpoint exact timing of failures
3. **Analyze Response Time** - See if slowdowns preceded the outage
4. **Calculate Impact** - Use Total Downtime to assess user impact
### Capacity Planning
Use historical data to plan infrastructure:
* **Response time trends** - Increasing over time may indicate capacity issues
* **Peak hours** - Identify when your service experiences highest load
* **Incident patterns** - Recurring issues at specific times suggest resource constraints
## Best Practices
Check monitor statistics weekly to catch trends before they become problems. Set calendar reminders if needed.
Use different time ranges to identify both immediate issues (24 hours) and long-term trends (90 days).
After deploying changes, check statistics to verify performance didn't degrade.
Include statistics in performance reviews and incident post-mortems to build awareness.
Document your typical performance metrics so you can quickly identify anomalies.
## Exporting Data
While viewing statistics, you can:
* **Screenshot** - Capture charts for reports and documentation
* **Note trends** - Document patterns for team discussions
* **Compare monitors** - Open multiple monitors in tabs to compare performance
Take screenshots of statistics before and after infrastructure changes to measure impact.
## Understanding Uptime Calculations
### How Uptime is Calculated
```
Uptime % = (Successful Checks / Total Checks) × 100
```
**Example:**
* Total checks in 24 hours: 1,440 (one per minute)
* Failed checks: 5
* Successful checks: 1,435
* Uptime: (1435 / 1440) × 100 = 99.65%
### SLA Targets
Common uptime Service Level Agreements (SLAs):
| Uptime % | Downtime per Year | Downtime per Month | SLA Tier |
| -------- | ----------------- | ------------------ | ----------------- |
| 99.9% | 8.76 hours | 43.8 minutes | Three nines |
| 99.95% | 4.38 hours | 21.9 minutes | High availability |
| 99.99% | 52.6 minutes | 4.38 minutes | Four nines |
| 99.999% | 5.26 minutes | 26.3 seconds | Five nines |
## Next Steps
Set up notifications based on performance metrics
Share uptime statistics with your users
Adjust monitor configuration
Configure organization-wide alerting
## Time Range Selection
Use the time range selector in the top right to view statistics for different periods:
* **Last 24 hours** - Most recent day of data
* **Last 7 days** - Weekly trends
* **Last 30 days** - Monthly overview
* **Last 90 days** - Quarterly analysis
* **Custom range** - Specific date range
Start with "Last 24 hours" for recent issues, then zoom out to longer periods to identify trends.
## Key Metrics
The statistics page displays four primary metrics at the top:
### Uptime Percentage
Shows the percentage of successful checks during the selected time period.
**Example:** `100.00%`
* **100%** - Perfect uptime, all checks successful
* **99.9%** - Highly reliable (approximately 43 minutes downtime per month)
* **99.0%** - Acceptable (approximately 7 hours downtime per month)
* **Below 99%** - Indicates reliability issues requiring attention
**Check Count:**
Shows successful checks vs. total checks (e.g., "7928 / 7928 checks")
### Average Response Time
The mean response time across all checks in the selected period.
**Example:** `94ms`
**Interpreting Response Times:**
* **0-100ms** - Excellent performance
* **100-300ms** - Good performance
* **300-1000ms** - Acceptable, monitor for degradation
* **1000ms+** - Slow, may impact user experience
Response time includes DNS lookup, connection establishment, and data transfer - the complete user experience.
### Total Incidents
Number of downtime events during the selected period.
**Example:** `0`
An incident is counted when:
* Multiple consecutive checks fail (based on alert sensitivity)
* Monitor transitions from operational to down/degraded
**Downtime Events:**
Lower is better. Zero incidents indicates perfect reliability.
### Total Downtime
Total minutes the monitor was offline during the selected period.
**Example:** `0m`
**Understanding Downtime:**
* **0 minutes** - No downtime detected
* **\< 5 minutes** - Brief outage, possibly maintenance
* **5-60 minutes** - Significant incident
* **> 60 minutes** - Major outage requiring investigation
## Response Time Chart
### Average and P95 Response Times
The response time chart shows two important metrics:
**Average Response Time (Blue/Green Line):**
* Mean response time across all checks
* Shows typical performance
* Useful for identifying gradual degradation
**P95 Response Time (Orange/Yellow Line):**
* 95th percentile response time
* 95% of requests are faster than this value
* Reveals worst-case performance users experience
### Reading the Chart
**Y-Axis:** Response time in milliseconds (ms)
**X-Axis:** Time period
**Patterns to Watch:**
* **Flat lines** - Consistent, predictable performance
* **Gradual increase** - Performance degrading over time
* **Spikes** - Temporary performance issues
* **High P95 divergence** - Some users experiencing slow responses
If P95 is significantly higher than average, some users are experiencing much slower responses than others.
## Uptime Percentage Chart
### Hourly Uptime Trend
Shows uptime percentage calculated hourly over the selected time period.
**Y-Axis:** Uptime percentage (0-100%)
**X-Axis:** Time (hours)
**What to Look For:**
* **Flat at 100%** - Perfect uptime
* **Dips below 100%** - Periods of downtime or failed checks
* **Patterns** - Recurring issues at specific times (e.g., daily at midnight might indicate scheduled processes)
### Understanding Hourly Calculations
Each point on the chart represents the uptime percentage for that specific hour:
* If all checks in an hour succeeded: 100%
* If some checks failed: Lower percentage based on failure rate
* If all checks failed: 0%
## Using Statistics for Analysis
### Performance Optimization
Review 30-day statistics to understand typical response times and uptime patterns.
Define acceptable performance targets (e.g., 99.9% uptime, \< 200ms average response).
Regularly check statistics to catch performance degradation early.
When you see unusual patterns, correlate with deployments, traffic changes, or infrastructure changes.
### Incident Investigation
When investigating an incident:
1. **Check Total Incidents** - Identify how many outages occurred
2. **Review Uptime Chart** - Pinpoint exact timing of failures
3. **Analyze Response Time** - See if slowdowns preceded the outage
4. **Calculate Impact** - Use Total Downtime to assess user impact
### Capacity Planning
Use historical data to plan infrastructure:
* **Response time trends** - Increasing over time may indicate capacity issues
* **Peak hours** - Identify when your service experiences highest load
* **Incident patterns** - Recurring issues at specific times suggest resource constraints
## Best Practices
Check monitor statistics weekly to catch trends before they become problems. Set calendar reminders if needed.
Use different time ranges to identify both immediate issues (24 hours) and long-term trends (90 days).
After deploying changes, check statistics to verify performance didn't degrade.
Include statistics in performance reviews and incident post-mortems to build awareness.
Document your typical performance metrics so you can quickly identify anomalies.
## Exporting Data
While viewing statistics, you can:
* **Screenshot** - Capture charts for reports and documentation
* **Note trends** - Document patterns for team discussions
* **Compare monitors** - Open multiple monitors in tabs to compare performance
Take screenshots of statistics before and after infrastructure changes to measure impact.
## Understanding Uptime Calculations
### How Uptime is Calculated
```
Uptime % = (Successful Checks / Total Checks) × 100
```
**Example:**
* Total checks in 24 hours: 1,440 (one per minute)
* Failed checks: 5
* Successful checks: 1,435
* Uptime: (1435 / 1440) × 100 = 99.65%
### SLA Targets
Common uptime Service Level Agreements (SLAs):
| Uptime % | Downtime per Year | Downtime per Month | SLA Tier |
| -------- | ----------------- | ------------------ | ----------------- |
| 99.9% | 8.76 hours | 43.8 minutes | Three nines |
| 99.95% | 4.38 hours | 21.9 minutes | High availability |
| 99.99% | 52.6 minutes | 4.38 minutes | Four nines |
| 99.999% | 5.26 minutes | 26.3 seconds | Five nines |
## Next Steps
Set up notifications based on performance metrics
Share uptime statistics with your users
Adjust monitor configuration
Configure organization-wide alerting