> ## Documentation Index
> Fetch the complete documentation index at: https://getmonitor.io/docs/llms.txt
> Use this file to discover all available pages before exploring further.
# Creating Monitors
> Learn how to set up uptime monitors for your websites, APIs, and services
## Creating a New Monitor
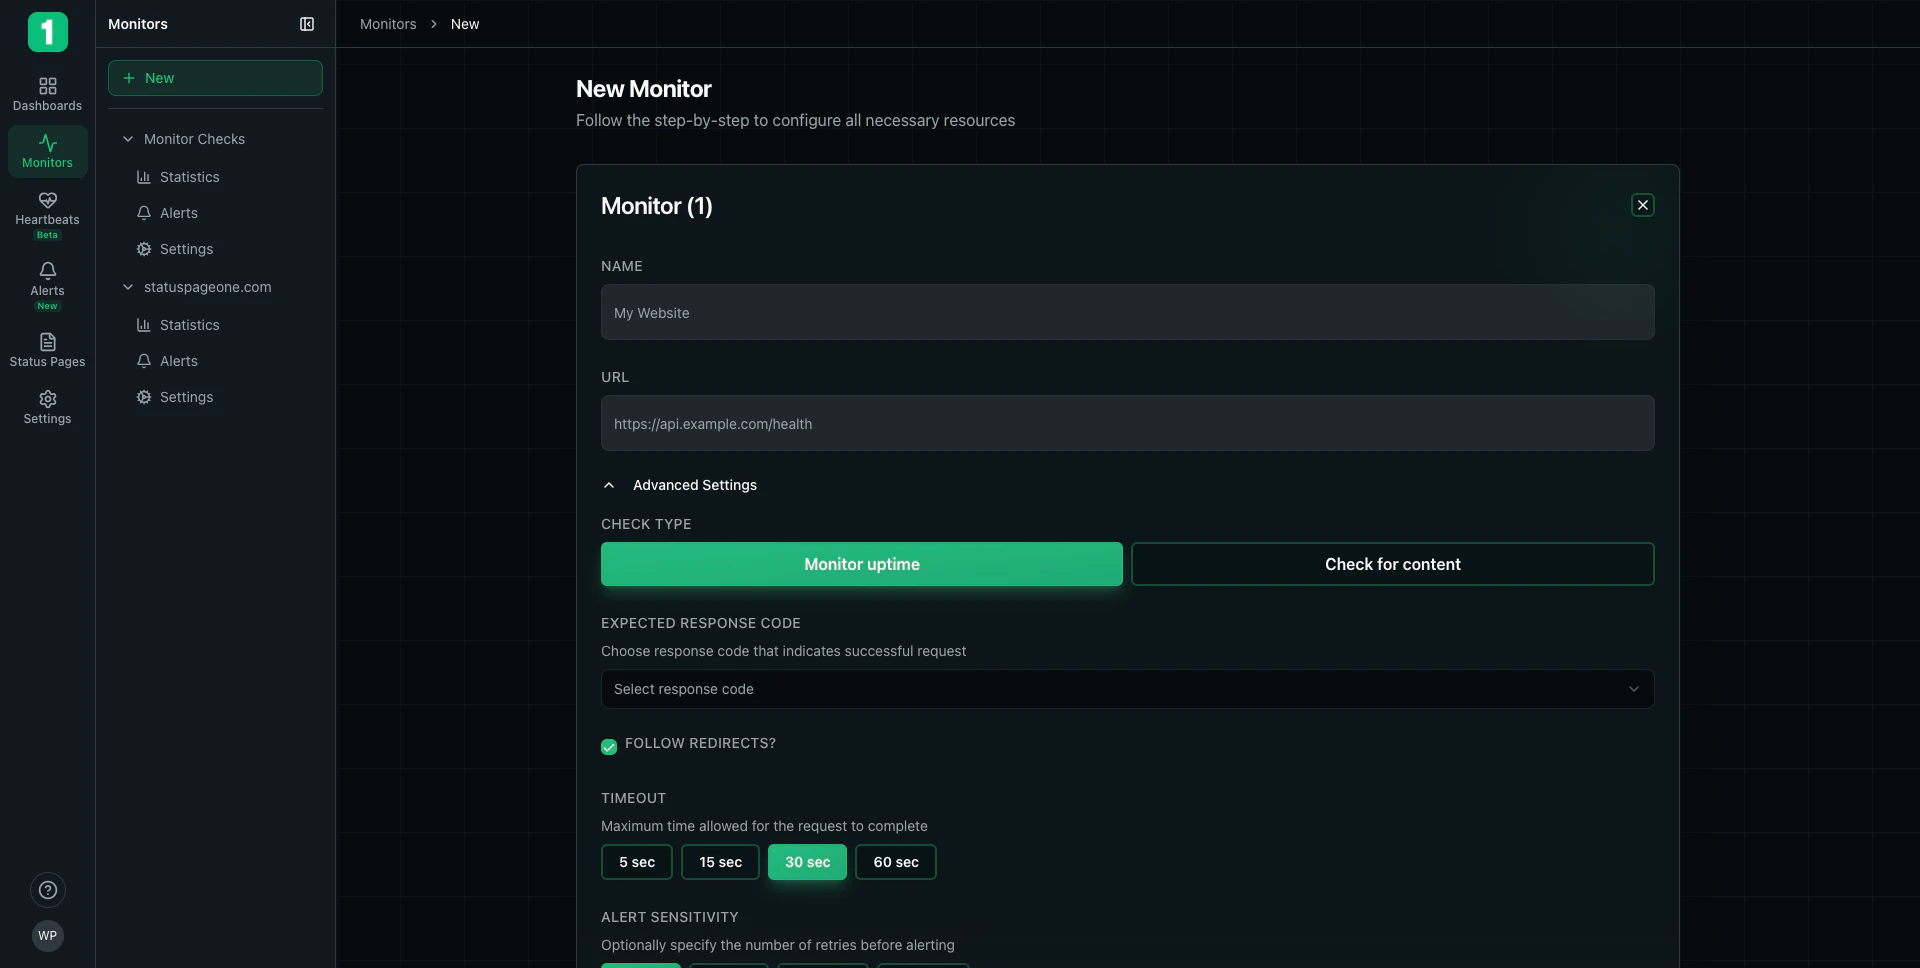
To create a new monitor, click the **+ New** button in the Monitors sidebar or click **Add monitor** from the monitors list.
 ## Basic Configuration
### Monitor Name
Give your monitor a descriptive name that identifies what you're monitoring.
**Examples:**
* "Production API"
* "Marketing Website"
* "Payment Gateway"
* "Customer Portal"
Use clear, descriptive names so team members can quickly identify what each monitor checks.
### URL
Enter the full URL you want to monitor, including the protocol (http\:// or https\://).
**Examples:**
* `https://api.example.com/health`
* `https://www.example.com`
* `https://app.example.com/status`
The URL will be checked every minute to verify availability and measure response time.
## Advanced Settings
Click **Advanced Settings** to access additional configuration options.
### Check Type
Choose how you want to monitor your endpoint:
Checks if your endpoint is accessible and responding. This is the most common monitor type.
**Best for:**
* Websites
* API health checks
* Service availability monitoring
Verifies that your endpoint is not only accessible, but also contains specific content.
**Best for:**
* Ensuring pages load completely
* Validating API responses
* Content verification
### Expected Response Code
Select the HTTP status code that indicates a successful request.
**Common Options:**
* **200: OK** - Standard successful response (default)
* **201: Created** - For POST requests that create resources
* **204: No Content** - For successful requests with no response body
* **Other codes** - Select from dropdown for specific requirements
Most monitors should use 200 (OK). Only change this if your endpoint intentionally returns a different success code.
### Follow Redirects
Enable this option to have monitors follow HTTP redirects (301, 302, etc.).
**When to enable:**
* ✓ Your URL redirects to another page (e.g., http → https)
* ✓ You want to check the final destination after redirects
**When to disable:**
* ✗ You want to verify the redirect itself works correctly
* ✗ You're testing redirect behavior
If disabled, redirect responses (301, 302) may be treated as failures unless you set the expected response code accordingly.
### Timeout
Set the maximum time to wait for a response before considering the check failed.
**Available Options:**
* **5 seconds** - For fast, local services
* **15 seconds** - For most web applications
* **30 seconds** - Standard timeout (recommended)
* **60 seconds** - For slower endpoints or complex operations
Start with 30 seconds. Only increase if you have endpoints that legitimately require longer response times.
### Alert Sensitivity
Configure how many consecutive failures must occur before triggering an alert.
**Purpose:**
* Reduces false alarms from temporary network issues
* Ensures alerts only fire for sustained problems
* Balances early warning with accuracy
**Recommended Settings:**
* **1-2 retries** - Critical services requiring immediate notification
* **3-4 retries** - Most production services (balanced approach)
* **5+ retries** - Services with occasional expected timeouts
## Editing Monitor Settings
You can modify monitor configuration at any time from the monitor's Settings page.
## Basic Configuration
### Monitor Name
Give your monitor a descriptive name that identifies what you're monitoring.
**Examples:**
* "Production API"
* "Marketing Website"
* "Payment Gateway"
* "Customer Portal"
Use clear, descriptive names so team members can quickly identify what each monitor checks.
### URL
Enter the full URL you want to monitor, including the protocol (http\:// or https\://).
**Examples:**
* `https://api.example.com/health`
* `https://www.example.com`
* `https://app.example.com/status`
The URL will be checked every minute to verify availability and measure response time.
## Advanced Settings
Click **Advanced Settings** to access additional configuration options.
### Check Type
Choose how you want to monitor your endpoint:
Checks if your endpoint is accessible and responding. This is the most common monitor type.
**Best for:**
* Websites
* API health checks
* Service availability monitoring
Verifies that your endpoint is not only accessible, but also contains specific content.
**Best for:**
* Ensuring pages load completely
* Validating API responses
* Content verification
### Expected Response Code
Select the HTTP status code that indicates a successful request.
**Common Options:**
* **200: OK** - Standard successful response (default)
* **201: Created** - For POST requests that create resources
* **204: No Content** - For successful requests with no response body
* **Other codes** - Select from dropdown for specific requirements
Most monitors should use 200 (OK). Only change this if your endpoint intentionally returns a different success code.
### Follow Redirects
Enable this option to have monitors follow HTTP redirects (301, 302, etc.).
**When to enable:**
* ✓ Your URL redirects to another page (e.g., http → https)
* ✓ You want to check the final destination after redirects
**When to disable:**
* ✗ You want to verify the redirect itself works correctly
* ✗ You're testing redirect behavior
If disabled, redirect responses (301, 302) may be treated as failures unless you set the expected response code accordingly.
### Timeout
Set the maximum time to wait for a response before considering the check failed.
**Available Options:**
* **5 seconds** - For fast, local services
* **15 seconds** - For most web applications
* **30 seconds** - Standard timeout (recommended)
* **60 seconds** - For slower endpoints or complex operations
Start with 30 seconds. Only increase if you have endpoints that legitimately require longer response times.
### Alert Sensitivity
Configure how many consecutive failures must occur before triggering an alert.
**Purpose:**
* Reduces false alarms from temporary network issues
* Ensures alerts only fire for sustained problems
* Balances early warning with accuracy
**Recommended Settings:**
* **1-2 retries** - Critical services requiring immediate notification
* **3-4 retries** - Most production services (balanced approach)
* **5+ retries** - Services with occasional expected timeouts
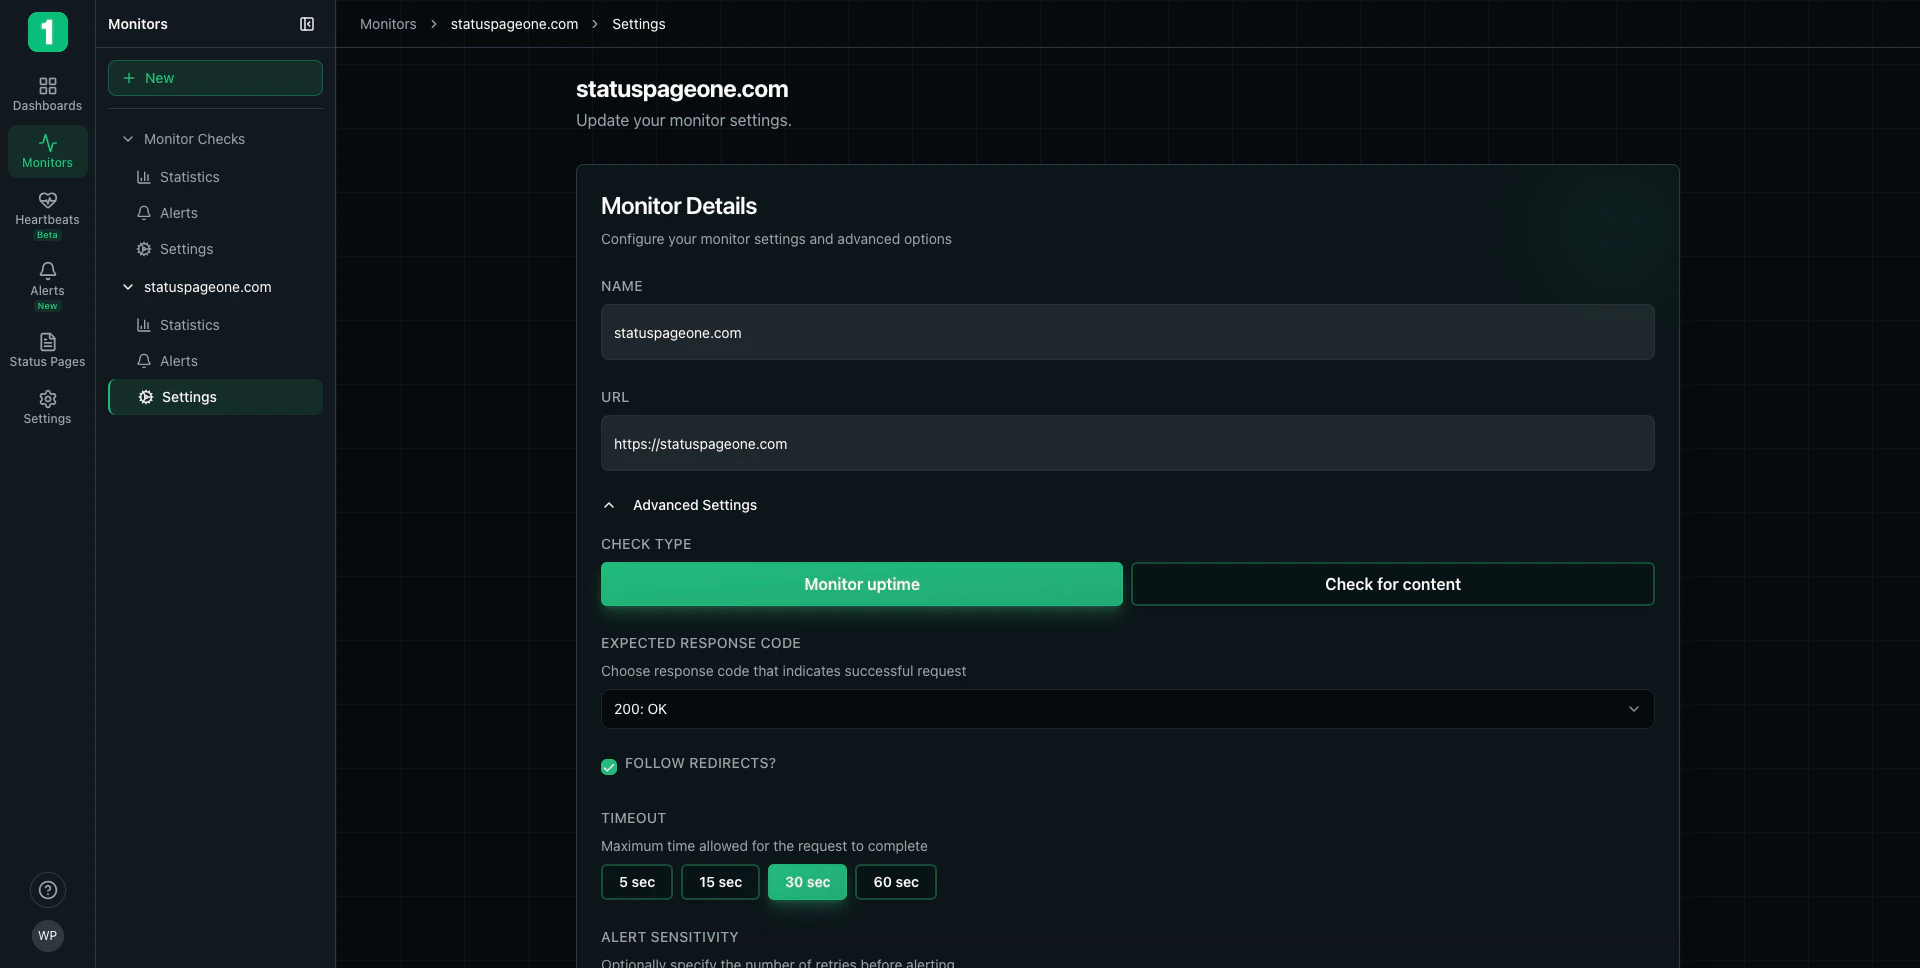
## Editing Monitor Settings
You can modify monitor configuration at any time from the monitor's Settings page.
 ### Updating Configuration
1. Navigate to your monitor in the sidebar
2. Click **Settings**
3. Modify any configuration options
4. Changes are saved automatically
## Configuration Examples
### Example 1: Simple Website Monitor
```
Name: Company Website
URL: https://www.example.com
Check Type: Monitor uptime
Expected Response Code: 200: OK
Follow Redirects: Enabled
Timeout: 30 seconds
Alert Sensitivity: 3 retries
```
### Example 2: API Health Check
```
Name: Production API Health
URL: https://api.example.com/health
Check Type: Monitor uptime
Expected Response Code: 200: OK
Follow Redirects: Disabled
Timeout: 15 seconds
Alert Sensitivity: 2 retries
```
### Example 3: Content Verification
```
Name: Landing Page Content Check
URL: https://www.example.com/landing
Check Type: Check for content
Expected Response Code: 200: OK
Follow Redirects: Enabled
Timeout: 30 seconds
Alert Sensitivity: 4 retries
```
## Best Practices
Instead of monitoring your homepage, create dedicated `/health` or `/status` endpoints that verify your application is functioning correctly.
Always use `https://` URLs when your service supports it to ensure secure monitoring.
Configure timeouts based on your actual response times. Check your statistics to see typical response times, then set timeouts 2-3x higher.
Too few retries creates false alarms. Too many delays real alerts. Start with 3-4 retries for most services.
After creating a monitor, wait a few minutes and check the Statistics page to verify it's working correctly.
## What Happens After Creation
Once you create a monitor:
1. **Immediate checks begin** - Your monitor starts checking every minute
2. **Data collection starts** - Statistics and uptime data begin accumulating
3. **Alerts activate** - Configured alert rules begin monitoring for failures
4. **Status page updates** - If linked to a status page, the component reflects monitor status
Learn how to analyze your monitor's performance data
## Troubleshooting
**Possible causes:**
* URL is incorrect or inaccessible
* Expected response code doesn't match actual response
* Timeout is too short
* Redirects are disabled but URL redirects
**Solution:** Check the Statistics page to see the actual response code and response time.
**Solution:** Increase alert sensitivity (more retries) to reduce false positives from transient issues.
**Note:** Response time includes DNS lookup, connection time, and data transfer. This is the total time your users experience.
## Next Steps
Analyze performance and uptime metrics
Set up notifications for downtime
Display monitor status publicly
Back to monitors overview
### Updating Configuration
1. Navigate to your monitor in the sidebar
2. Click **Settings**
3. Modify any configuration options
4. Changes are saved automatically
## Configuration Examples
### Example 1: Simple Website Monitor
```
Name: Company Website
URL: https://www.example.com
Check Type: Monitor uptime
Expected Response Code: 200: OK
Follow Redirects: Enabled
Timeout: 30 seconds
Alert Sensitivity: 3 retries
```
### Example 2: API Health Check
```
Name: Production API Health
URL: https://api.example.com/health
Check Type: Monitor uptime
Expected Response Code: 200: OK
Follow Redirects: Disabled
Timeout: 15 seconds
Alert Sensitivity: 2 retries
```
### Example 3: Content Verification
```
Name: Landing Page Content Check
URL: https://www.example.com/landing
Check Type: Check for content
Expected Response Code: 200: OK
Follow Redirects: Enabled
Timeout: 30 seconds
Alert Sensitivity: 4 retries
```
## Best Practices
Instead of monitoring your homepage, create dedicated `/health` or `/status` endpoints that verify your application is functioning correctly.
Always use `https://` URLs when your service supports it to ensure secure monitoring.
Configure timeouts based on your actual response times. Check your statistics to see typical response times, then set timeouts 2-3x higher.
Too few retries creates false alarms. Too many delays real alerts. Start with 3-4 retries for most services.
After creating a monitor, wait a few minutes and check the Statistics page to verify it's working correctly.
## What Happens After Creation
Once you create a monitor:
1. **Immediate checks begin** - Your monitor starts checking every minute
2. **Data collection starts** - Statistics and uptime data begin accumulating
3. **Alerts activate** - Configured alert rules begin monitoring for failures
4. **Status page updates** - If linked to a status page, the component reflects monitor status
Learn how to analyze your monitor's performance data
## Troubleshooting
**Possible causes:**
* URL is incorrect or inaccessible
* Expected response code doesn't match actual response
* Timeout is too short
* Redirects are disabled but URL redirects
**Solution:** Check the Statistics page to see the actual response code and response time.
**Solution:** Increase alert sensitivity (more retries) to reduce false positives from transient issues.
**Note:** Response time includes DNS lookup, connection time, and data transfer. This is the total time your users experience.
## Next Steps
Analyze performance and uptime metrics
Set up notifications for downtime
Display monitor status publicly
Back to monitors overview