> ## Documentation Index
> Fetch the complete documentation index at: https://getmonitor.io/docs/llms.txt
> Use this file to discover all available pages before exploring further.
# Getting Started with GetMonitor
> Learn how to access the console, navigate the interface, and get started with your first status page
## Welcome to GetMonitor
GetMonitor helps you monitor your services and communicate their status to your users. This guide will walk you through accessing the console and understanding the main interface.
## Accessing the Console
The GetMonitor console is available at [console.getmonitor.io](https://console.getmonitor.io).
 ### Sign In Options
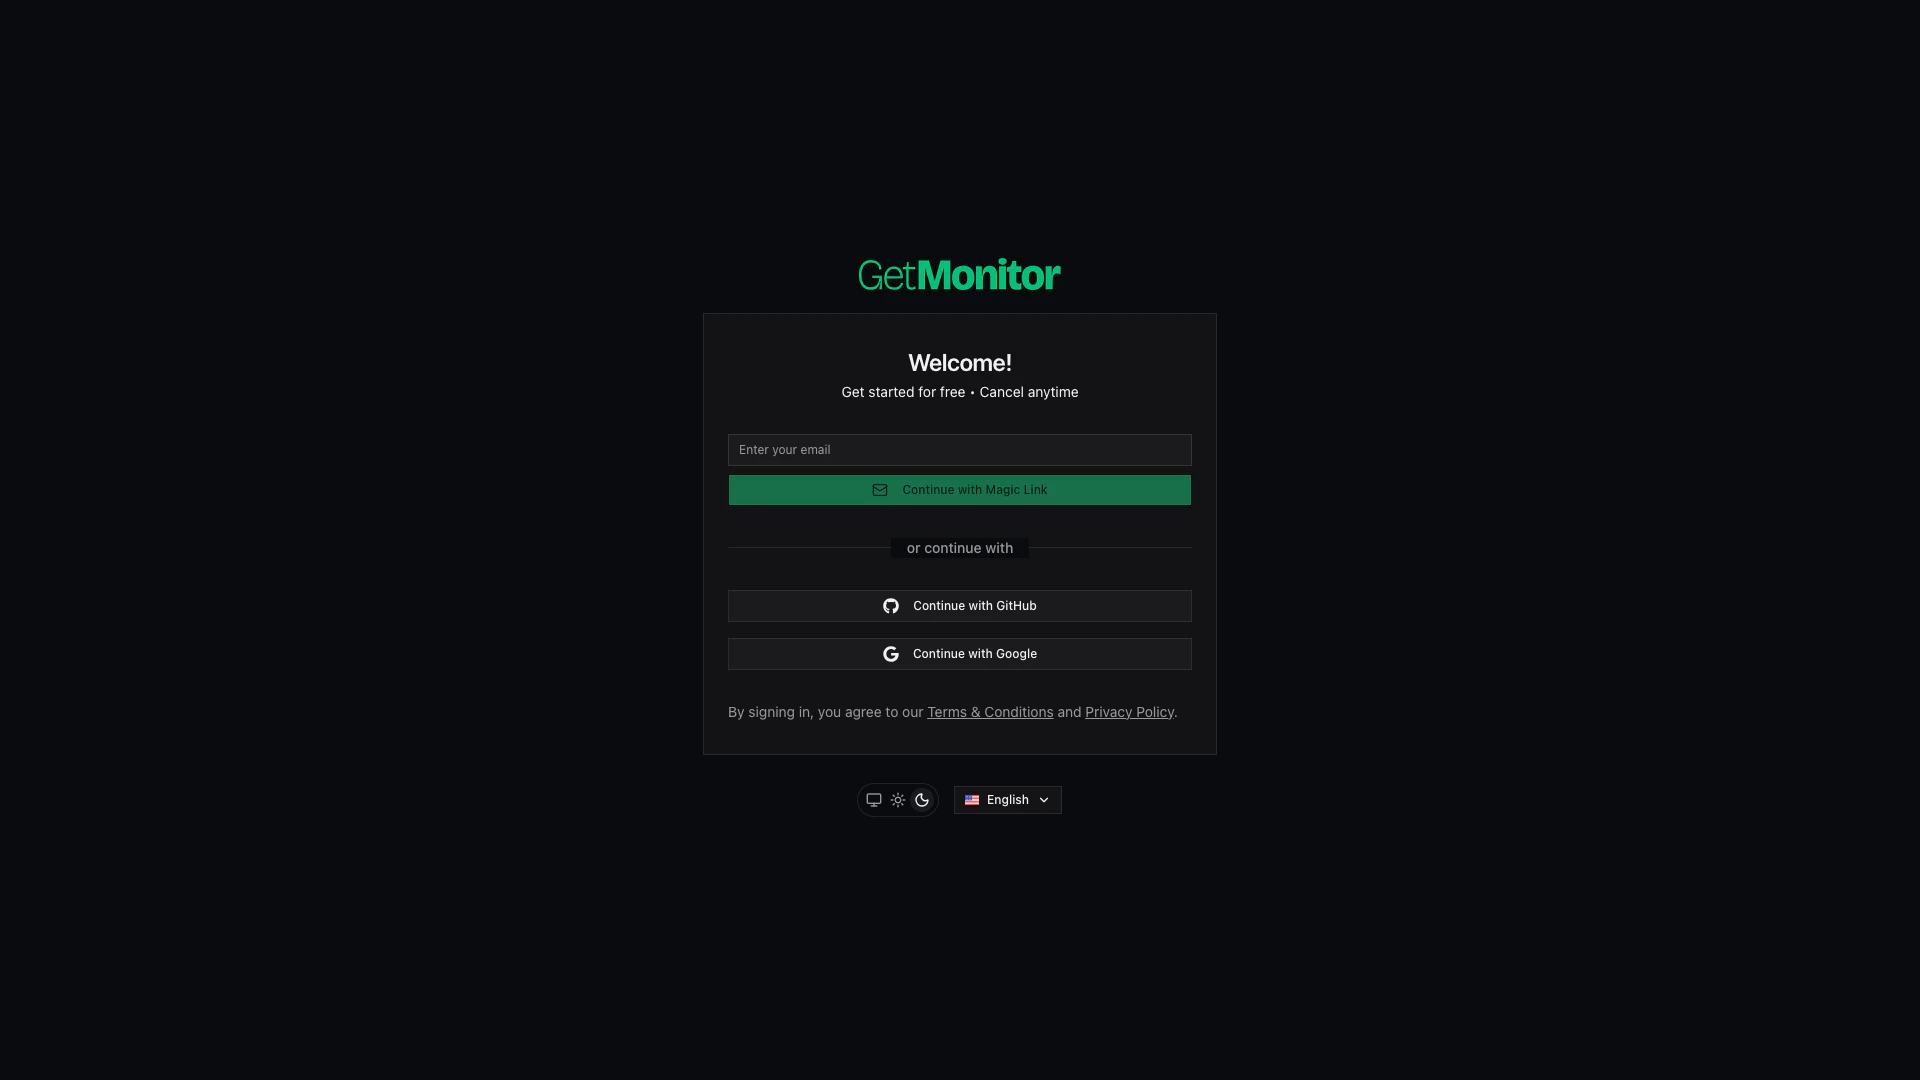
You can sign in using any of these methods:
* **Magic Link** - Enter your email and receive a secure login link
* **GitHub** - Sign in with your GitHub account
* **Google** - Sign in with your Google account
The platform is free to get started with no credit card required.
Choose the sign-in method that works best for your workflow. All methods provide the same access to your account.
## First-Time Setup
When you first sign in, you'll go through a quick onboarding process to set up your organization and first monitor.
### Sign In Options
You can sign in using any of these methods:
* **Magic Link** - Enter your email and receive a secure login link
* **GitHub** - Sign in with your GitHub account
* **Google** - Sign in with your Google account
The platform is free to get started with no credit card required.
Choose the sign-in method that works best for your workflow. All methods provide the same access to your account.
## First-Time Setup
When you first sign in, you'll go through a quick onboarding process to set up your organization and first monitor.
 ### Onboarding Steps
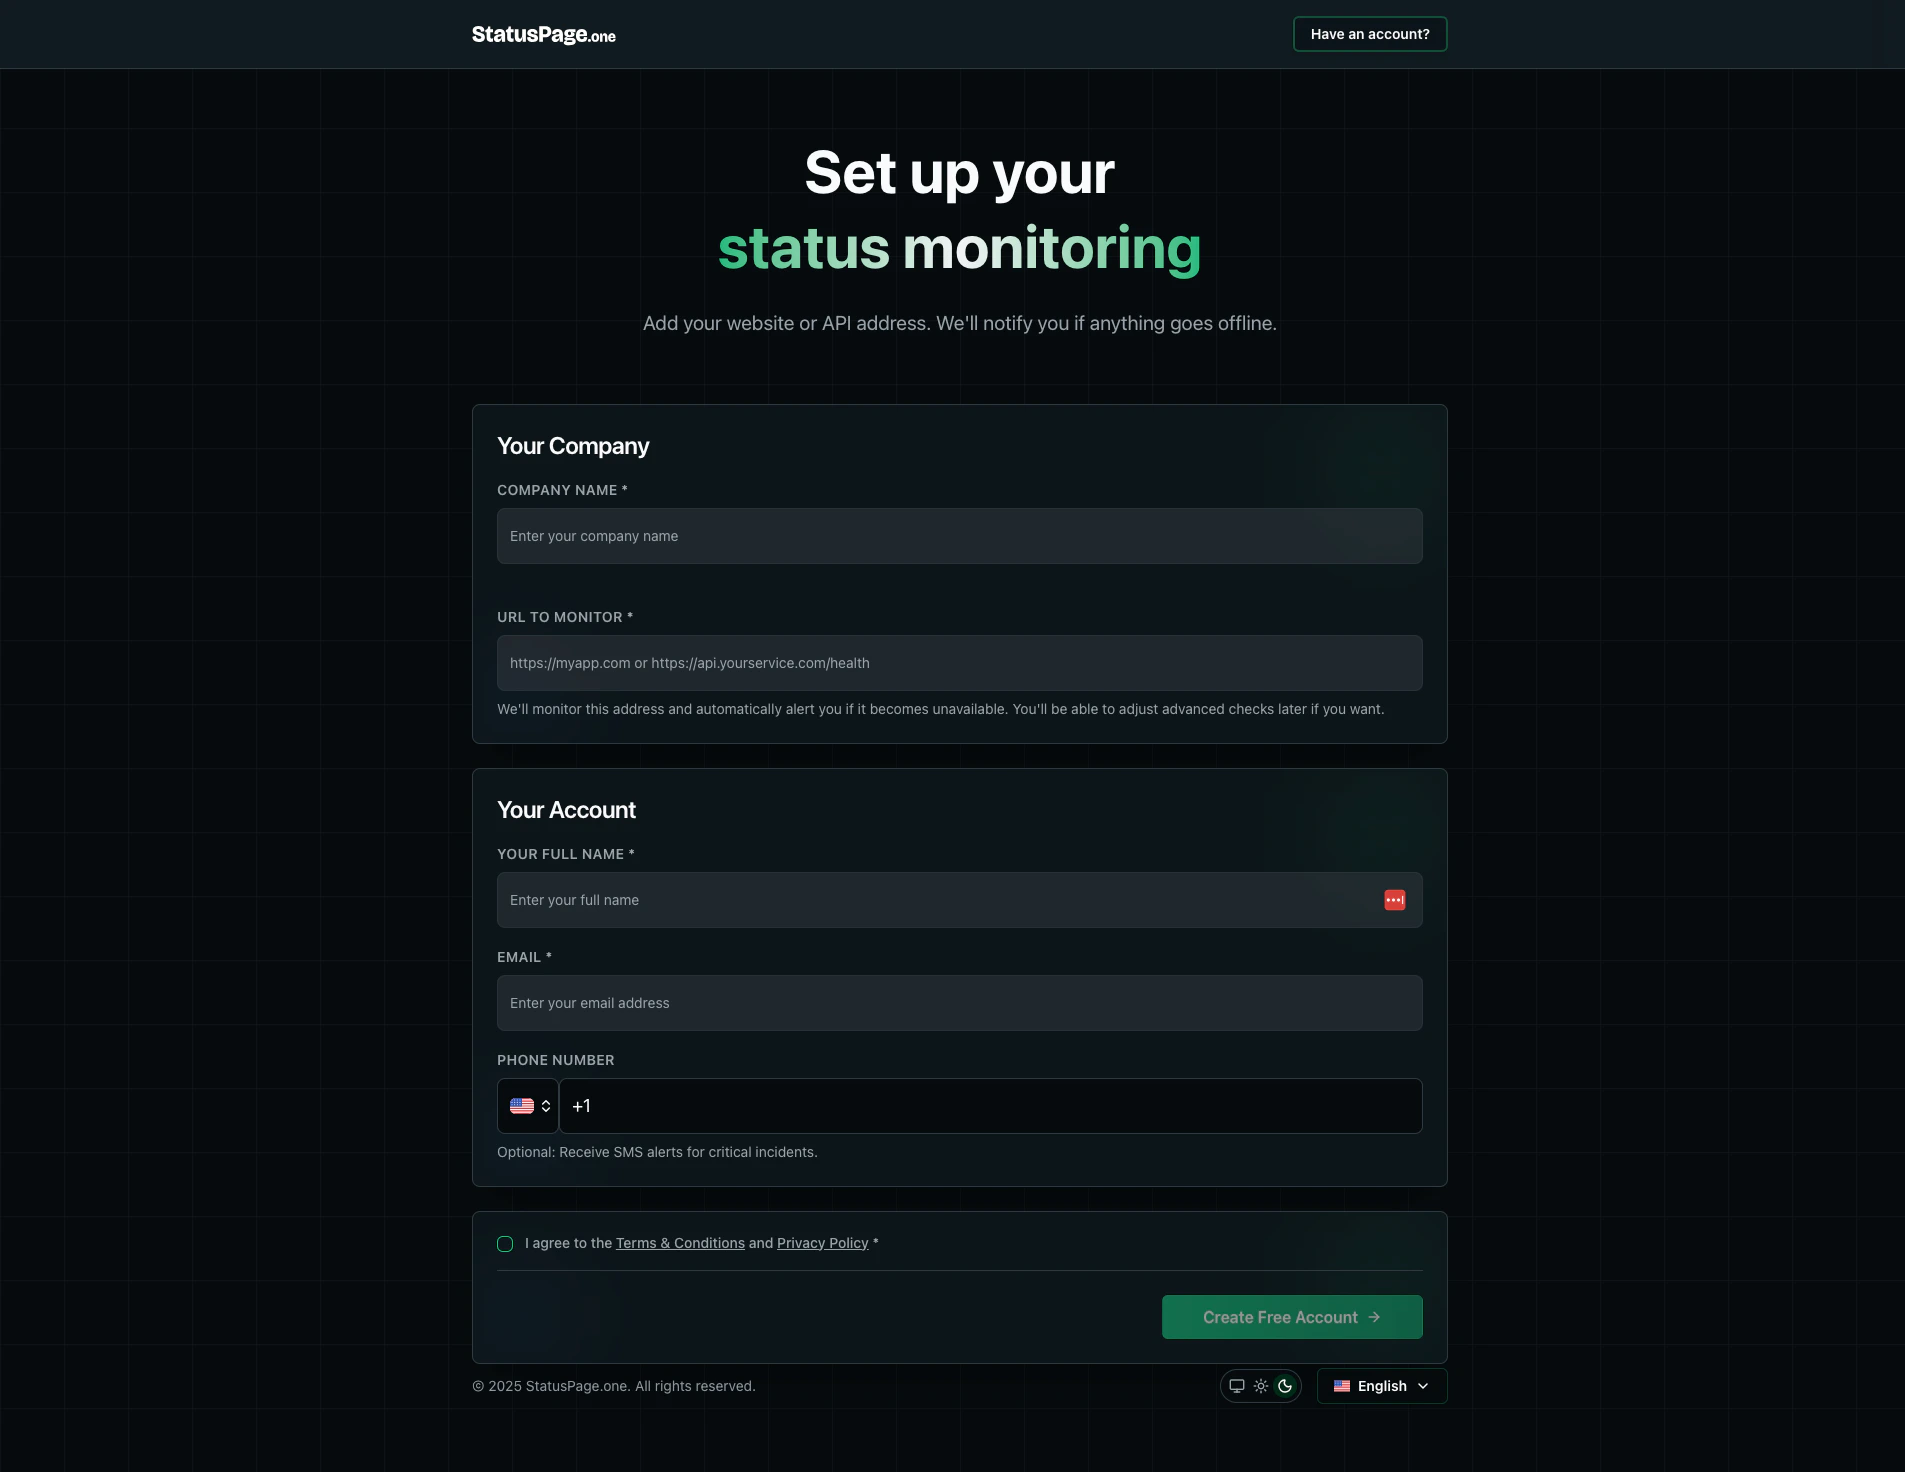
1. **Your Company** - Enter your company name and the URL you want to monitor
2. **Your Account** - Provide your full name, email, and optionally a phone number for SMS alerts
The onboarding process helps you get started quickly by creating your first monitor automatically.
## Dashboard Overview
After completing onboarding, you'll arrive at your organization dashboard - the central hub for monitoring your infrastructure.
### Onboarding Steps
1. **Your Company** - Enter your company name and the URL you want to monitor
2. **Your Account** - Provide your full name, email, and optionally a phone number for SMS alerts
The onboarding process helps you get started quickly by creating your first monitor automatically.
## Dashboard Overview
After completing onboarding, you'll arrive at your organization dashboard - the central hub for monitoring your infrastructure.
 ### Key Metrics
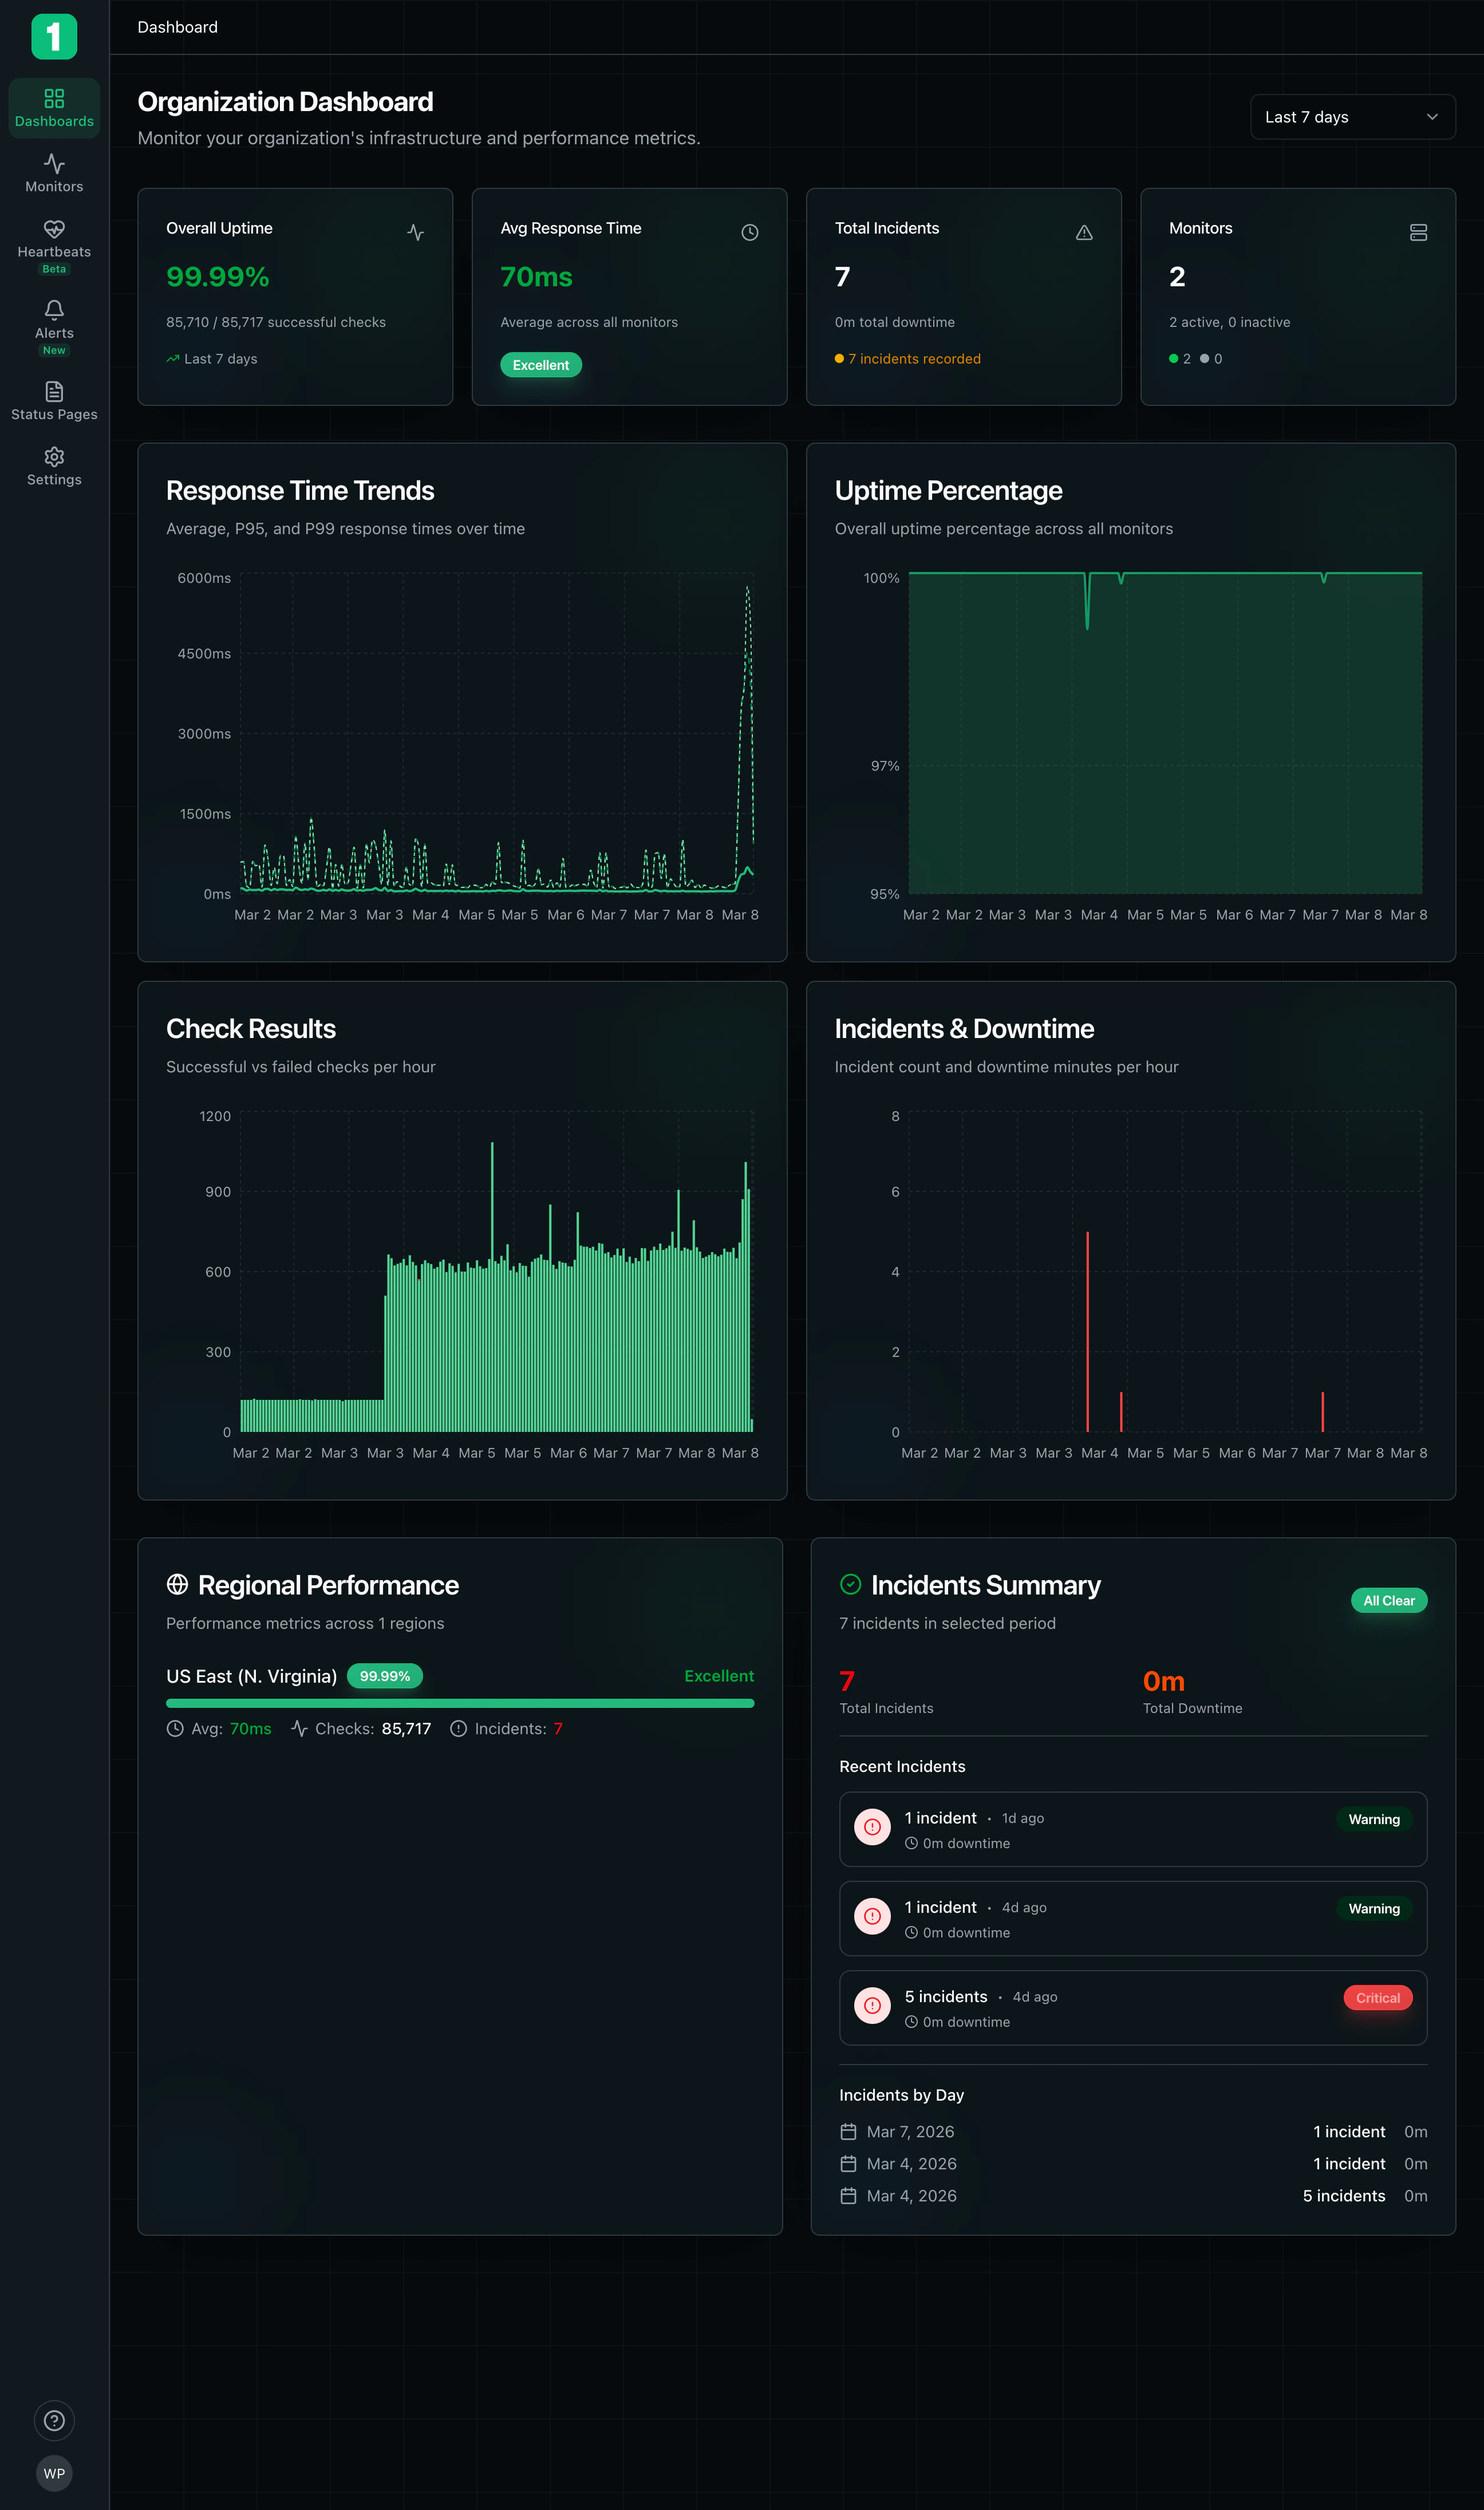
The dashboard displays several important metrics at a glance:
* **Overall Uptime** - Your infrastructure's uptime percentage over the selected time period
* **Average Response Time** - Average response time across all monitors
* **Total Incidents** - Number of incidents and total downtime
* **Monitors** - Count of active and inactive monitors
### Charts and Visualizations
The dashboard includes several real-time charts:
* **Response Time Trends** - Shows P95, P99 response times over time
* **Uptime Percentage** - Historical uptime trends across all monitors
* **Check Results** - Successful vs. failed checks per hour
* **Incidents & Downtime** - Incident frequency and duration
* **Regional Performance** - Performance metrics by geographic region
* **Incidents Summary** - Recent incidents with severity levels
### Time Range Selection
Use the time range selector in the top right to view metrics for:
* Last 7 days
* Last 30 days
* Last 90 days
* Custom date range
## Navigation
The left sidebar provides access to all main sections:
* **Dashboard** - Overview of your infrastructure health
* **Monitors** - Manage your uptime monitors
* **Heartbeats** - Monitor background jobs and scheduled tasks
* **Alerts** - Configure alert rules and notifications
* **Status Pages** - Create and manage public status pages
* **Settings** - Organization settings and team management
## Next Steps
Now that you're familiar with the console, here's what to do next:
Set up monitoring for your websites and APIs
Create a public status page for your users
Set up notifications for incidents
Collaborate with your team
## Language Support
GetMonitor supports multiple languages. You can change your language preference using the language selector in the bottom right corner of the console.
The interface automatically saves your work. All changes are persisted immediately without requiring manual saves.
### Key Metrics
The dashboard displays several important metrics at a glance:
* **Overall Uptime** - Your infrastructure's uptime percentage over the selected time period
* **Average Response Time** - Average response time across all monitors
* **Total Incidents** - Number of incidents and total downtime
* **Monitors** - Count of active and inactive monitors
### Charts and Visualizations
The dashboard includes several real-time charts:
* **Response Time Trends** - Shows P95, P99 response times over time
* **Uptime Percentage** - Historical uptime trends across all monitors
* **Check Results** - Successful vs. failed checks per hour
* **Incidents & Downtime** - Incident frequency and duration
* **Regional Performance** - Performance metrics by geographic region
* **Incidents Summary** - Recent incidents with severity levels
### Time Range Selection
Use the time range selector in the top right to view metrics for:
* Last 7 days
* Last 30 days
* Last 90 days
* Custom date range
## Navigation
The left sidebar provides access to all main sections:
* **Dashboard** - Overview of your infrastructure health
* **Monitors** - Manage your uptime monitors
* **Heartbeats** - Monitor background jobs and scheduled tasks
* **Alerts** - Configure alert rules and notifications
* **Status Pages** - Create and manage public status pages
* **Settings** - Organization settings and team management
## Next Steps
Now that you're familiar with the console, here's what to do next:
Set up monitoring for your websites and APIs
Create a public status page for your users
Set up notifications for incidents
Collaborate with your team
## Language Support
GetMonitor supports multiple languages. You can change your language preference using the language selector in the bottom right corner of the console.
The interface automatically saves your work. All changes are persisted immediately without requiring manual saves.